User Session Assessment Page
High Level Overview
While the Search page focuses more on sessions (Event Search coming soon!), the User Session Assessment page focuses on the events within a session. This page tells Spec customers a story about what the user accomplished (or tried to accomplish) during a session.
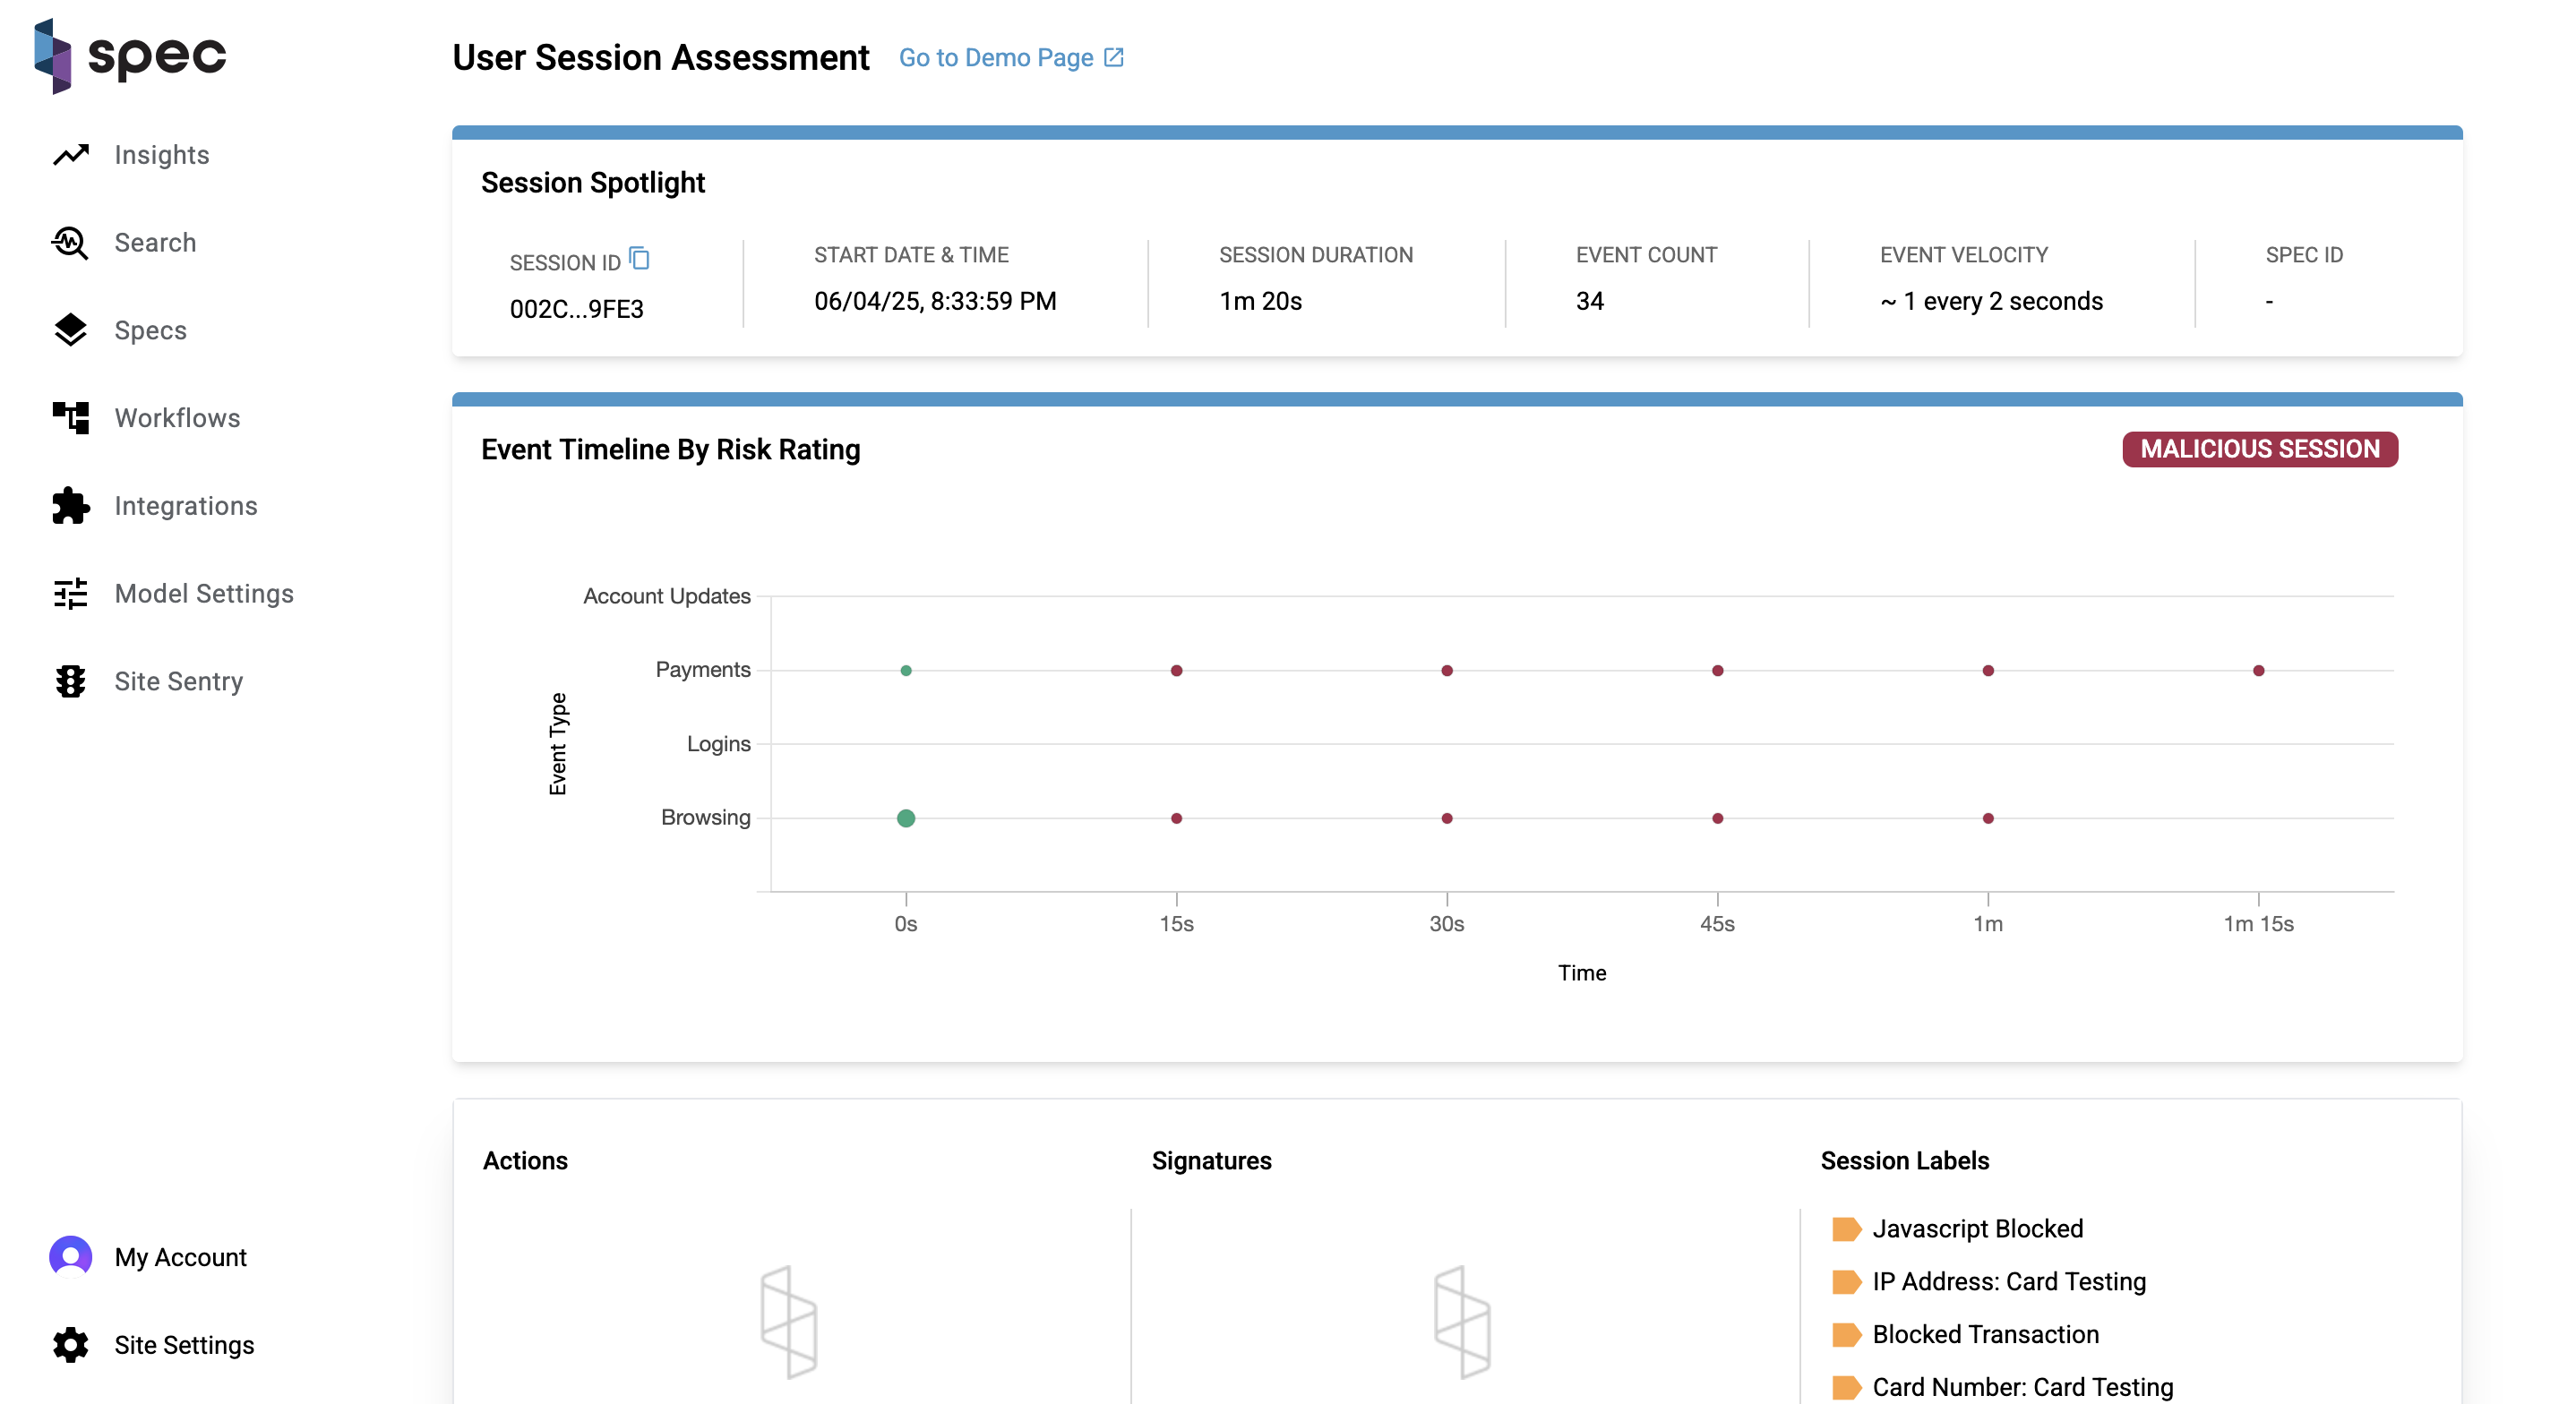
Session Spotlight
The spotlight highlights key data points about a session. These include:
- Session ID: Each session is attributed a unique identifier.
- Start Date and Time: When the session started.
- Session Duration: How long the session lasted.
- Event Count: How many events took place during the session.
- Event Velocity: The rate of events in the session.
- Spec ID: An element that links sessions together.
Event Timeline by Risk Rating Chart
This chart is a visualization of the user journey and a litmus test for the riskiness of a session. A session can be categorized under 3 levels of risk: normal (green), suspicious (yellow), and malicious (red). The banner on the right side of the chart tells you this is a malicious session.
The size of each bubble on the chart indicates the volume of events that took place during that bucket of time, and each bubble is given a color based on the session risk rating, which can change over time. You can see in the timeline of the chart exactly where the session turns from a normal session to a malicious session. If you hover over the bubbles on the chart, you can see what events took place at the time indicated by the x-axis. In the video above, you can see that the customer made multiple attempts at a payment, which ultimately resulted in payment failures.
Actions, Signatures, and Session Labels
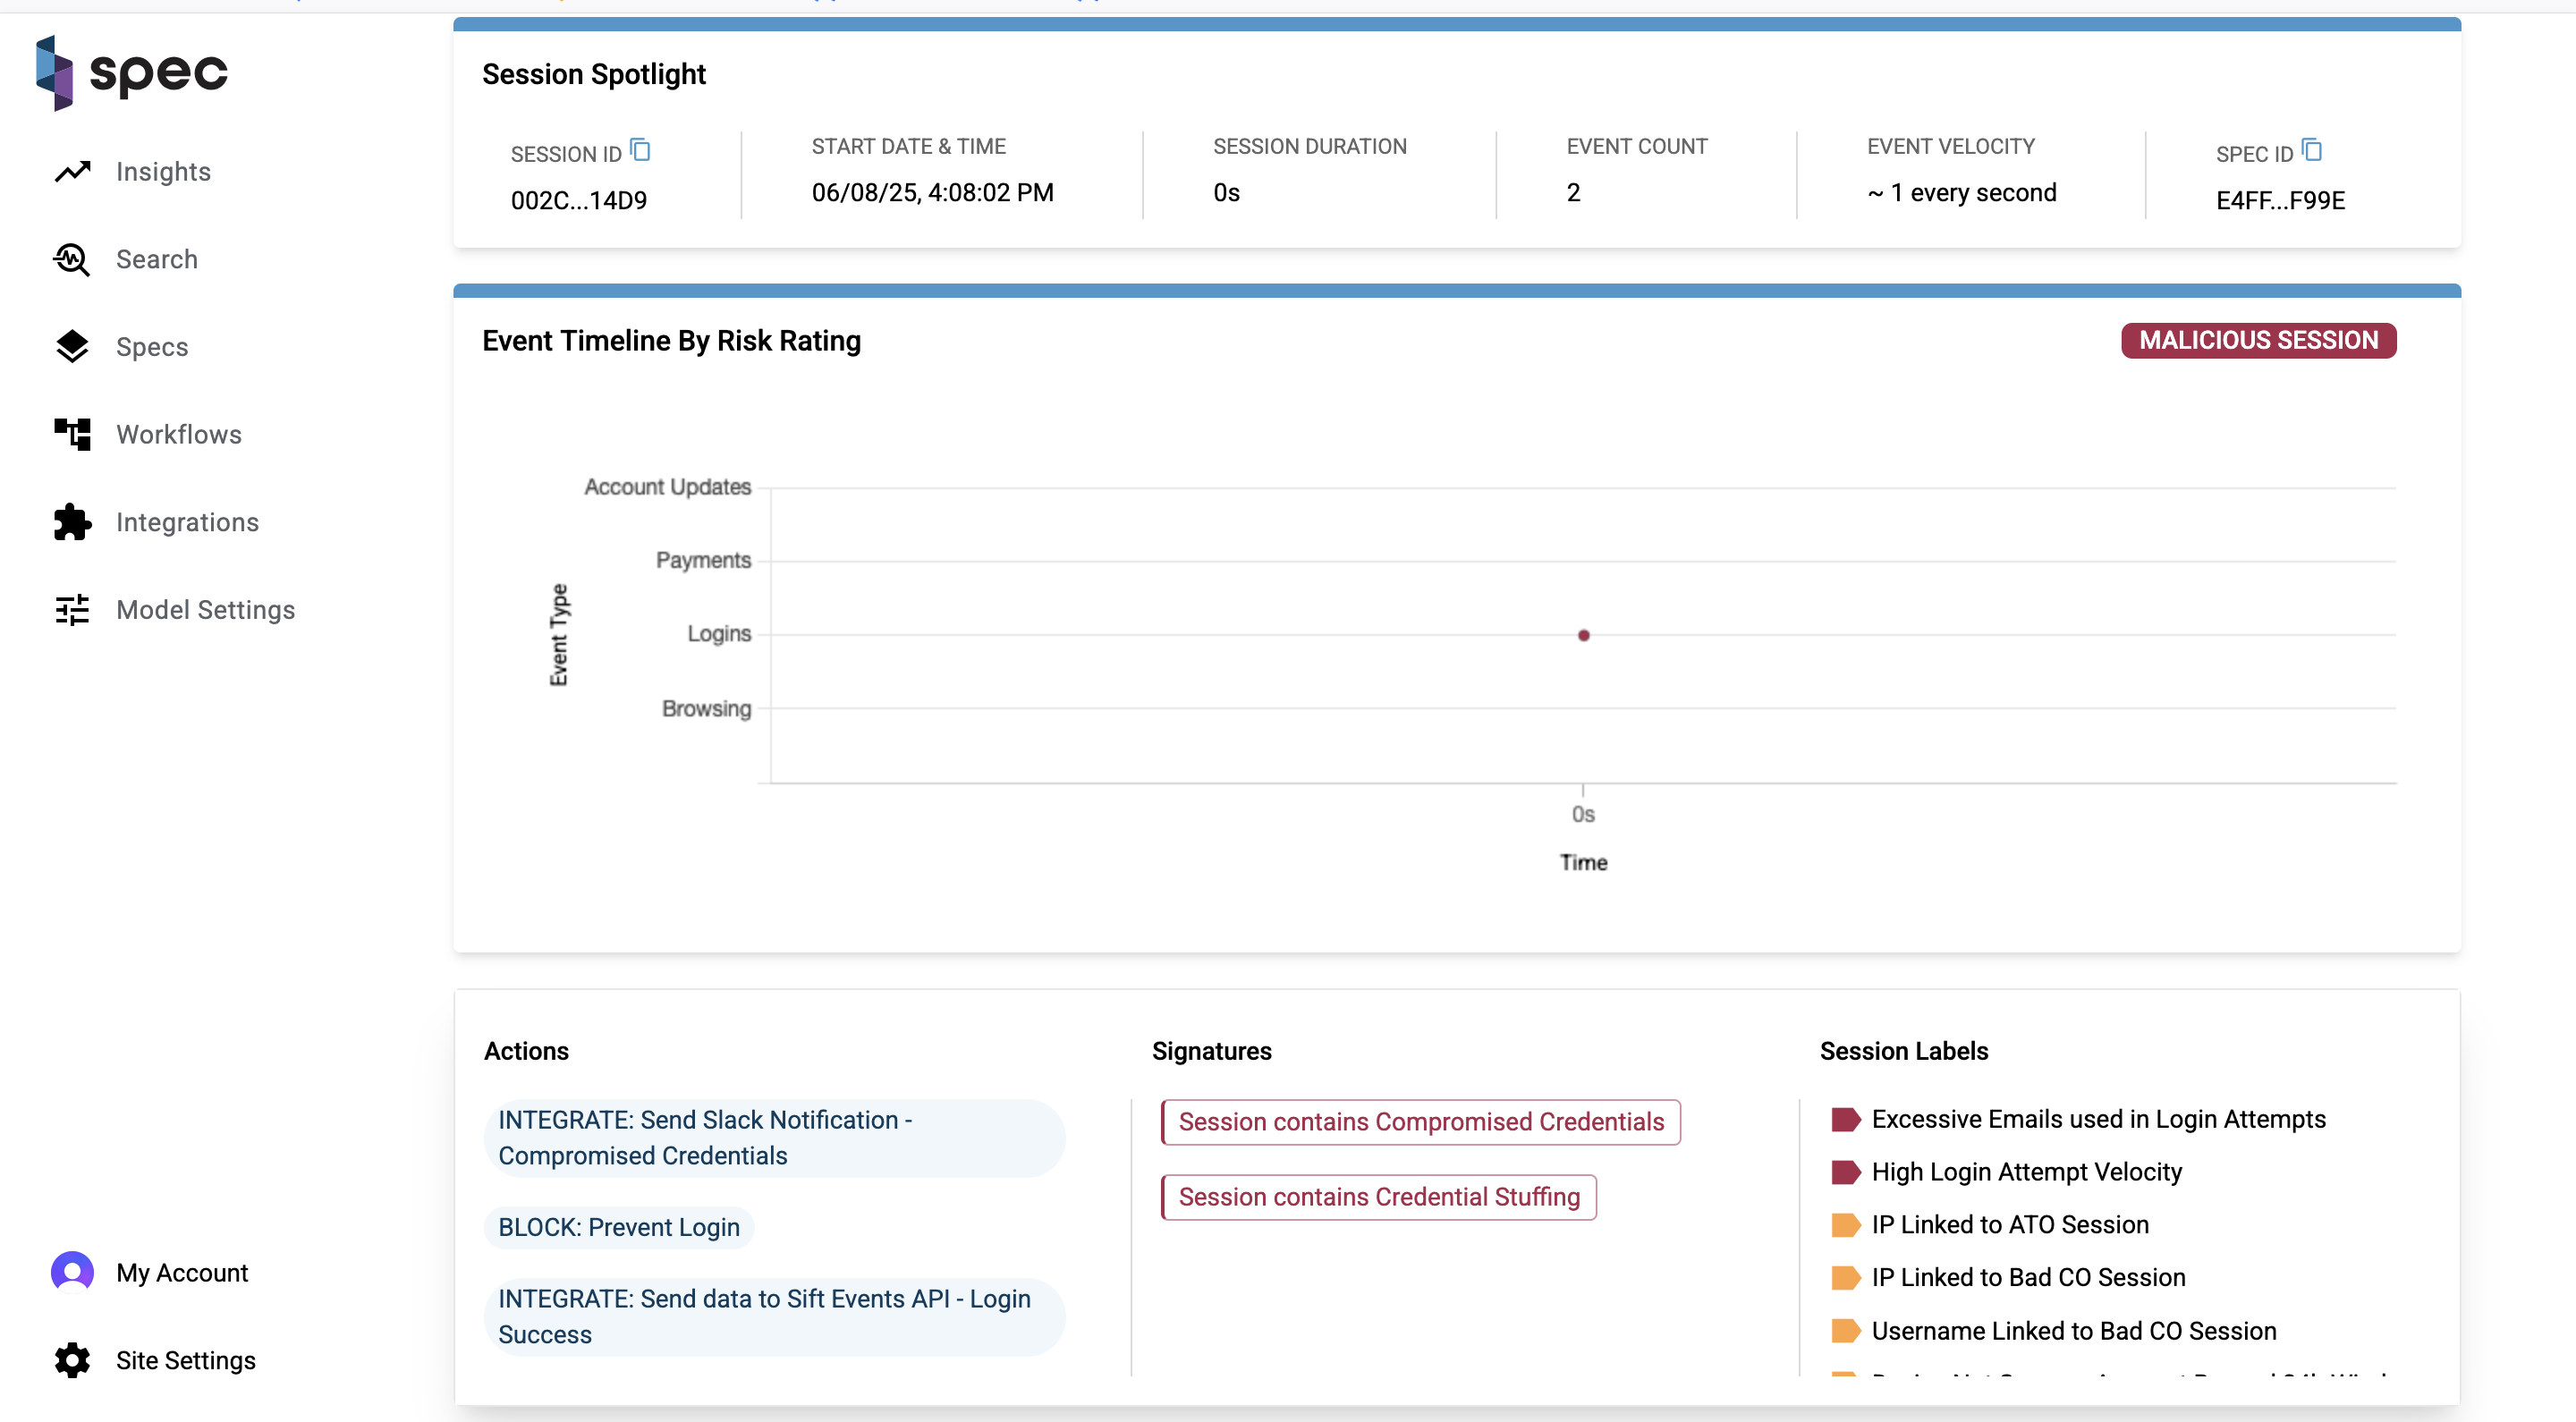
Session labels, signatures, and actions together describe the signals, patterns of behavior, and responses taken by the Spec platform for a given session. A collection of session labels can trigger the placement of a signature label, and actions are Spec's response to any of this activity.
You can actually see in the Event Timeline chart where an action was taken and a session ended. Here is a "honeypotting" example, in which a bad actor logs in and attempts to make a fraudulent refund request. Spec then takes action in response, displaying a fake honeypot so that the user thinks their fraudulent request was successful. With the user thinking they've accomplished their goal, the session ends.
The visuals of the Event Timeline by Risk Rating chart and the information on the Actions, Signatures, and Session Labels card show you how powerful the Spec engine is in stopping fraud in realtime and bringing that play-by-play to our customers.

Event Timeline Table
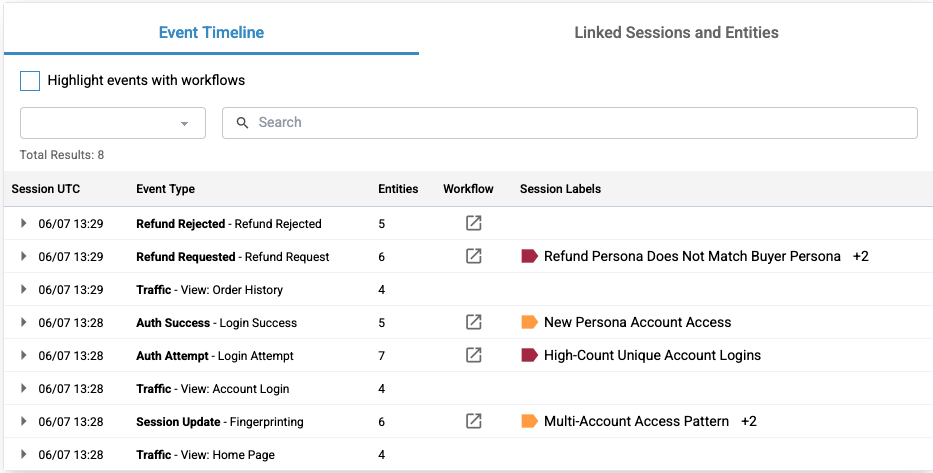
The Event Timeline table is an event-by-event breakdown of the session. Every piece of activity a user triggers on their session journey is laid out from start to finish on this table. The columns are listed as follows:
- Event UTC: The date and time the event took place in descending order.
- Event Type: Each event has an associated type. This column displays the type of the event and it's name.
- Entities: A count of the entities involved with the event.
- Workflow: If a workflow icon is present, a workflow was run on this event.
- Session Labels: If session labels are present, one or more labels were set on this event.
Each row on the table expands to show more information about the event.
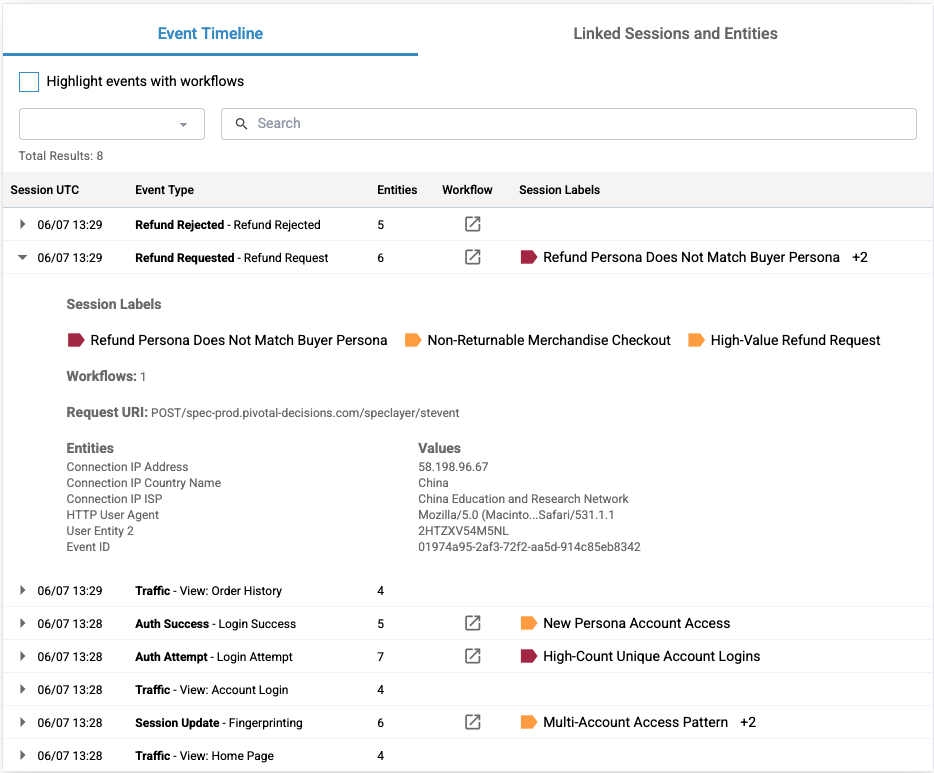
At the top of the expanded section is a list of the labels that were placed on the event. In the honeypotting example, the labels "Refund Persona Does Not Match Buyer Persona", "Non-Returnable Merchandise Checkout", and "High-Value Refund Request" were placed on the "Refund Requested" event. One workflow ran on this request. You can also see the entities that were involved as well.
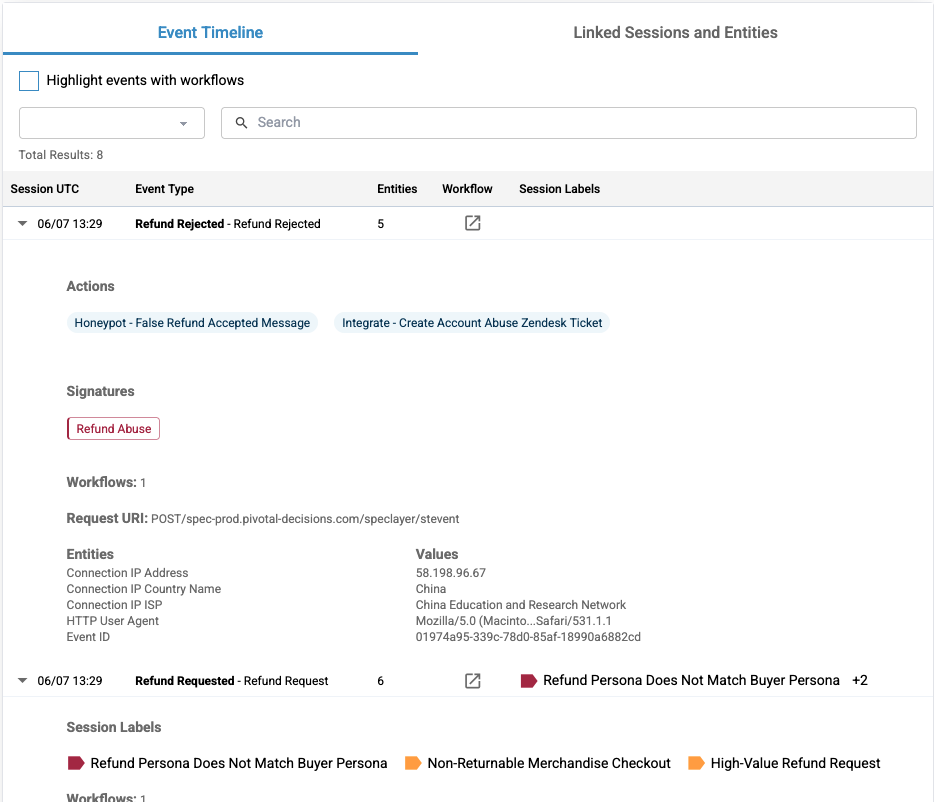
In the last event that took place on the session, you can see that the signature "Refund Abuse" and the honeypotting action was taken.
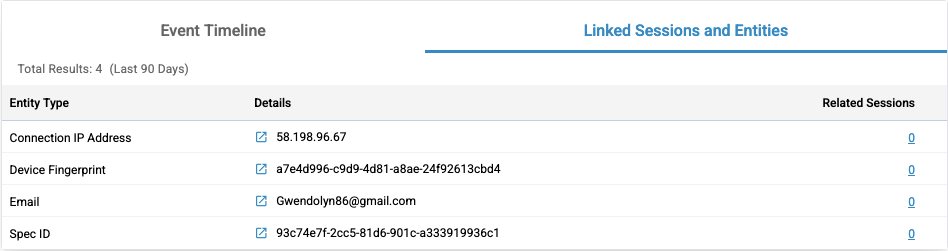
Linked Sessions and Entities
Finally, the Linked Sessions and Entities table displays a list of important entities involved in the session. Here are the columns for this table:
- Entity Type: Every entity has an associated type (example: "email").
- Entity Detail: The entity value (example: "sample@email.com").
- Related Sessions: Count of all the sessions the entity appears in.
Click the icon to the left of the entity detail to navigate to the Entity Linking and Behavior page, which allows you to investigate that entity further. See the document Entity Behavior & Linking page for more information on this. Click on the number under the Related Sessions column for an entity to explore all of the sessions in which the entity has been.