Welcome to the Spec Docs
Overview
The Spec Platform analyzes traffic to your websites and APIs to proactively detect and mitigate fraudulent users and abusive bots before they can do damage to your customer flows.
Businesses use Spec to:
- Detect - behavior and linking associated with fraudulent and abusive application usage in realtime and when good users are presented with unnecessary friction from internal fraud tools.
- Investigate - session replays of suspicious users.
- Mitigate - abusive users before they damage customer flows.
The Spec Platform invisibly collects and leverages large amounts of contextual user behavioral data at the perimeter of your web application, so that your business can use Spec to proactively detect malicious behavior that internal fraud tools cannot.
Integration Options
The Spec Platform has numerous integration methods. The commonality between them is that they allow the Spec Platform to reside in the path of web traffic between your end users and your protected origins. Residing in the path of web traffic enables the Spec Platform to capture, analyze, and respond to all origin-bound traffic for abnormal behavior.
The integration methods listed below are the most commonly used. If your preferred integration method is not listed above, please ask your Product Success representative.
Native
Service Worker
Explore Concepts
Get to know Spec Platform and how it provides Customer Journey Security:
Overview
Introduction
In today's digital landscape, where fraudsters exploit every possible touchpoint, understanding the complete user journey is paramount. Traditional fraud detection tools often operate in silos, analyzing isolated events without the broader context, leaving gaps that sophisticated attackers can exploit. Recognizing this challenge, Spec's pioneering Realtime User Behavior Tracking makes user interaction silos a problem of the past. This revolutionary approach captures and analyzes every user interaction, from the moment a customer lands on your platform to their final click. By stitching together these interactions into a cohesive event timeline, Spec provides unparalleled visibility, enabling teams to detect anomalies, prevent fraudulent activities, and ensure a seamless experience for legitimate users.
Spec deploys our Realtime Engine at the network layer. This product operates transparently, is undetectable by client browsers, and does not require any client side JavaScript or SDKs. We integrate seamlessly at your public network endpoint, which requires only a single deploy. The Realtime Engine is responsible for extracting data from incoming network requests, normalizing it, and labeling that data with a name and type. We record these data elements from each request into an Event. Our engine investigates the timeline of user journey Events, which we call a Session, and provides a Label for any observed behaviors, whether risky or trusted.
The data generated by our RE is captured for analysis within the Hub. The Hub is a web interface that offers behavioral insights and tooling for investigations that is updated in realtime.
The Spec Platform is a zero JavaScript implementation with flexible deployment options and transparent operation that is undetectable by clients. The platform is a powerful, realtime engine capable of executing highly performant risk assessments and can perform extensive third-party integrations to complement your existing systems.
How Spec Works
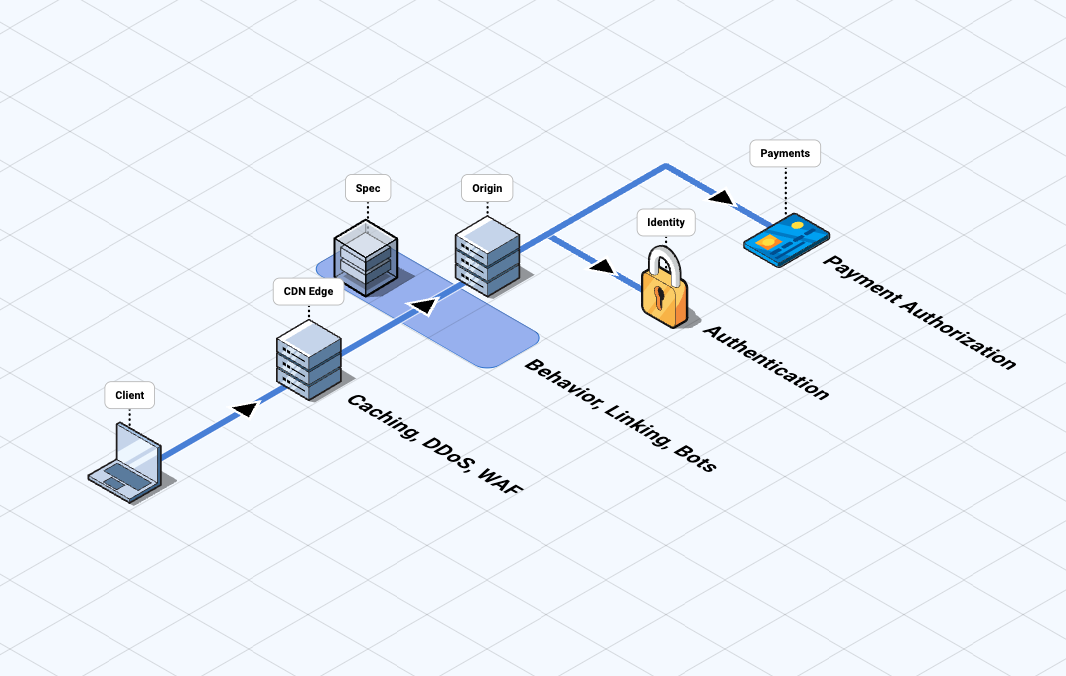
The Spec Realtime Engine (RE) sits in the path of web traffic between your end users and your protected origins, enabling you to capture, analyze, and respond to all origin-bound traffic for anomalous behavior.
The RE gathers data and triggers rules-based workflows based on customer-defined configurations, tailored specifically to align with your unique business model. You can configure actions and view collected data and labeled findings in the Spec Hub.
The RE only collects the data it is configured to collect. Requests to endpoints that the Realtime Engine is not configured to monitor are never collected nor read; they are passed directly through to the protected origin. For endpoints it is configured to monitor, all data not explicitly configured to be collected is ignored.
Data and labeled findings are streamed to the Spec analytics platform in real time and are immediately accessible to you through the Hub. Optional third-party integrations to further enrich your data are also fully configurable and managed through the Hub.
The following diagram shows the Realtime Engine in action.

Product
Spec's product consists of two main components: the Realtime Engine and the Hub. The Realtime Engine operates at the network layer to capture, analyze, and label every user interaction in real time, enabling advanced risk assessment and automated mitigation without requiring client side code. The Hub is a web-based interface that provides realtime monitoring, analytics, configuration management, and investigation tools, empowering teams to visualize user journeys, detect suspicious patterns, and manage integrations—all in one unified platform.
Realtime Engine
The Realtime Engine (RE) is the workhorse of the Spec platform. This engine is responsible for extracting data from incoming network requests, normalizing it, and labeling that data with a name and type. Models that detect risky user journey patterns execute within the engine. These models are tuned specifically to customer applications to generate risk assessments that form the foundation of the rest of the platform's capabilities. These risk assessments can be used to stop activity on your platform or alert you when it occurs. Your data is never shared with anyone, for any reason.
One of the greatest powers the Realtime Engine has is the ability to mitigate. Mitigation is the capability of the platform to modify incoming requests, outgoing responses, or generate a response to a request without involving the customer application. These actions can only be taken when the platform is operating in Active Mode.
Actions taken by the RE are performed by the rules engine in the platform. Rules provide flexibility and control by fine tuning when actions are taken by the platform. Actions govern mitigation, generating alerts, or sending information to other platforms.
The RE can incorporate any third party data into the realtime dataset. We do this through Integrations which can contact other applications over HTTP. Retrieving more data is not its only use; these integrations can be used to open tickets in your case tracking software when risky activity is detected. We can also alert you through your favorite channels when this activity is observed and merits further investigation. In addition, Integrations allow the RE to make calls to other platforms to perform further actions.
note
Integrations are not required. The Realtime Engine can make risk assessments, monitor and alert, and take action without using any third party services.
Hub
Insights
Insights provide trend visualizations and analytics that describe the population of the application. These insights describe trends in the Session, Event, and Element activity within the platform. There are insights provided for each module that describe common scenarios like Account Take Over (ATO) and Card Testing attacks.
Session Search
Session Search enables users to find and analyze Sessions based on specific criteria. Users can access a directory of saved session searches, view recent searches, and build new queries using filters. Saved searches promote efficient, reusable searches and improve performance by encouraging the use of saved, cacheable queries. The interface supports quick navigation, sorting, and searching through session data, making it easier for analysts to answer questions about user interactions.
User Session Assessment
The User Session Assessment provides a comprehensive overview of an individual Session. It features a visual “guitar chart” that tracks the session’s risk rating evolution over time and highlights the final risk score. You can see the Session Labels associated with a session organized by severity, as well as any actions taken. The page includes a session spotlight with key summary points and an events tab listing all session events, with options to filter the view. We describe the session's Entities along with the set of linked entities, those entities that have been seen in the same session.
Entity Behavior and Linking
The Entity Behavior and Linking page focuses on how Entities, such as accounts or devices, interact within and across sessions. It provides insights into shared sessions between entities, helping analysts identify patterns, relationships, and potential risks by tracking how entities are linked through shared activity.
Tech and Scale
The Spec Realtime Engine utilizes cloud-native, industry-proven technologies such as Kubernetes, Rust, and Kafka to deliver scalability, performance, and security.
| Kubernetes |  |
| Rust | |
| Kafka |  |
High Availability and Scalability
Spec's workloads run in load-balanced, self-healing, containerized environments in cloud infrastructure across multiple data centers. With Kubernetes and auto-scaling infrastructure, Spec Realtime Engine scales as you do.
For production-grade customer offerings, failover mechanisms are implemented across multiple layers to ensure high availability and maintain business continuity.
Performance and Reliability
The ability to process large amounts of traffic in real time is accomplished by a proprietary platform built for high performance using throughput-oriented technologies such as Rust and Kafka. 100% of the Spec Realtime Engine is written in Rust, with minimal system dependencies. Rust allows us to achieve maximum performance without the reliability issues and security vulnerabilities often present in other systems programming languages. Kafka allows Spec to durably and quickly move data from the edge into our data warehouse for long-term access and storage.
Spec uses infrastructure as code to reliably create and maintain the platform. This allows us to set up new client environments quickly and keep configuration consistent at all times.
Spec uses a third party logging and monitoring solution that is an industry standard for cloud-based platforms. The team utilizes a paging system and an on-call rotation to ensure that any and all issues are investigated as soon as they become apparent.
Security
Spec views the security of its cloud as paramount: we run daily audits on all code that runs as part of the platform to ensure that it is free from any known vulnerabilities. Any new CVEs that are discovered are addressed immediately. Software updates are deployed on a frequent and regular basis to deploy security patches, introduce new features, and enhance existing functionality.
Spec conducts regular internal security audits to ensure platform compliance at all times, extending beyond the duration and scope of SOC2 audits.
Spec Hub
The Hub is a secure web platform that centralizes access to critical data and tools for customers and internal teams. It authenticates users via single sign-on (SSO) or other secure methods, ensuring sensitive features remain protected. Role-based permissions provide fine-grained control over what users can see and do. With this strong foundation, the Hub offers a reliable interface for managing, investigating, and reporting on the data flowing through the Spec Platform.
At the heart of the Hub are its advanced insights and analytics capabilities, which leverage a modern data infrastructure to deliver fast, actionable reporting. The Insights feature visualizes trends and aggregates session data, helping users quickly assess risk, spot anomalies, and demonstrate the value of the platform. Session Search is an investigative tool, enabling users to search, filter, and inspect user journeys in detail — crucial for both operational monitoring and deep investigations. For investigative workflows, the Hub provides the User Session Assessment (USA), enabling deeper dives into individual Session details. Together, these features make the Hub an indispensable platform for data-driven decision-making and fraud prevention.
Insights Dashboard
Quick View into Customer Behavior and Risk
What It Is
Insights Dashboard gives a high-level overview of what’s going on across your environment — no SQL, no exports. Just the important behavioral signals, surfaced in a clean and interactive way.
It’s useful for spotting things like refund abuse, login spikes, suspicious activity — anything that might require a closer look.
You can dig in right away and take action without waiting on someone to pull logs.
How It Works
Modules
Insights are grouped by modules — each focused on a specific use case (like
refund abuse, login anomalies, or support misuse).
Each module includes a set of visualizations built around that theme.
Insight Cards
Inside each module, you’ll see Insight cards. Each card tracks a specific behavior — like "Spike in Password Resets" or "Unusual Login Attempts."
Clicking on a card shows a line chart with 6-hour intervals across the past 7 days, so you can quickly spot trends and timing.
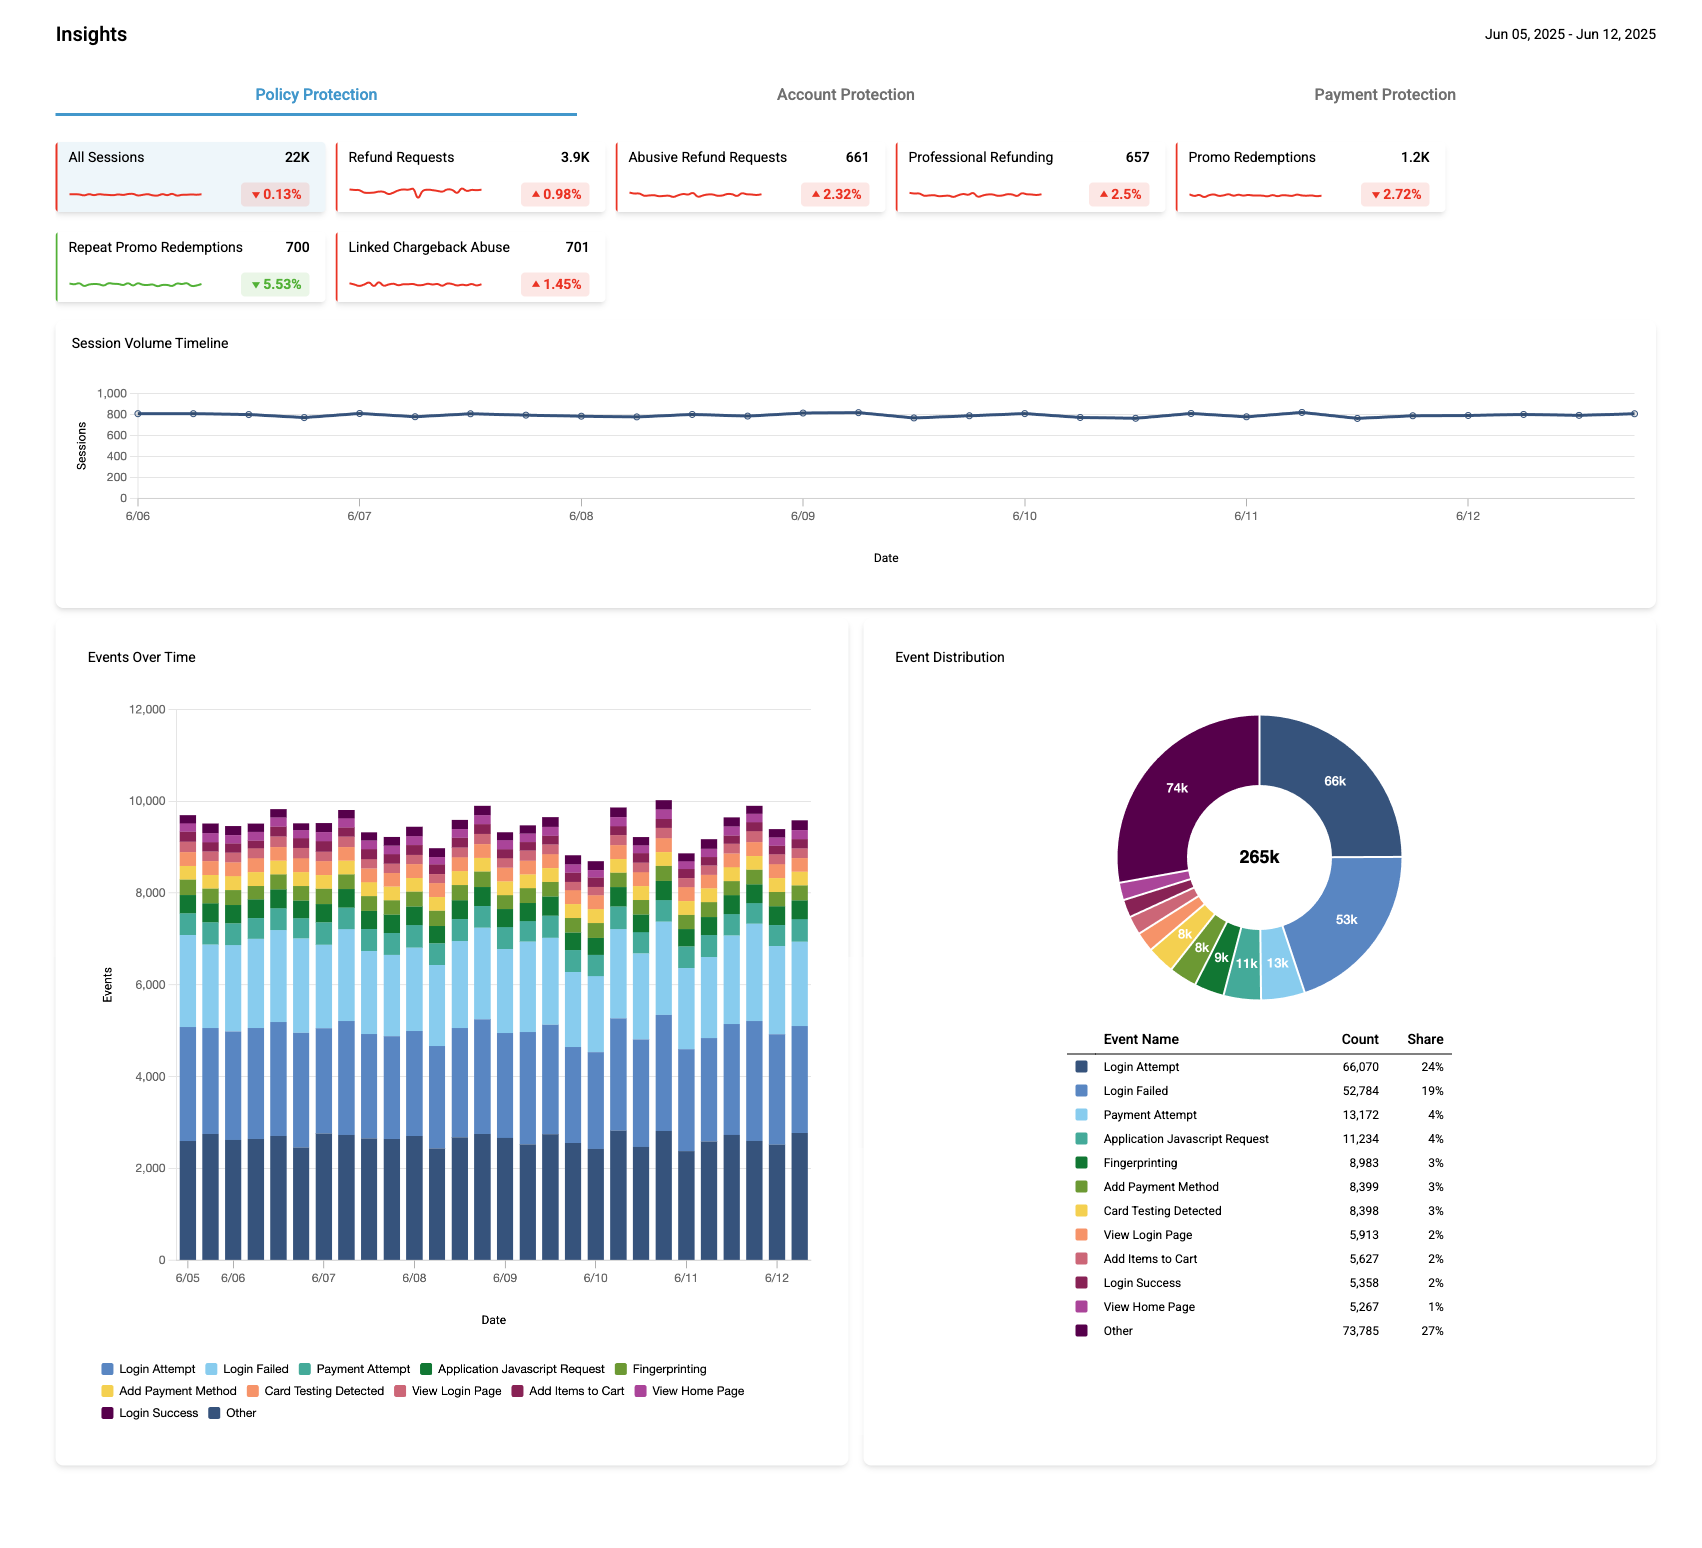
Event Views
For every Insight card there are also the following charts:
- Events Over Time bar chart: Top daily event types from the last 7 days, grouped to reduce noise (less frequent ones go under "Other").
- Event Distribution chart: Same data shown as proportions — good for quickly spotting what’s dominant.
Charts update automatically as you filter and explore the dashboard.
Customization
Dashboards are tailored for your setup. That means:
- We set up modules specific to your use cases.
- Visuals can be adjusted to surface the behaviors your team cares about.
Each customer sees a setup that reflects their environment and workflows.
Why It’s Useful
Fraud moves fast — and event logs aren’t always the best way to see the full picture. Insights helps you:
- Spot issues earlier: no need to dig through raw data.
- Get context: across sessions, accounts, and time.
- Reduce noise: and focus on what actually matters.
- Share what you see: make it easier to loop in others.
Setup
We will configure insights for you during your onboarding process. If
something’s missing, or if you want to add a new module, just reach out to the
Spec team.
We’ll help get the right views in place.
Search Page
High Level Overview
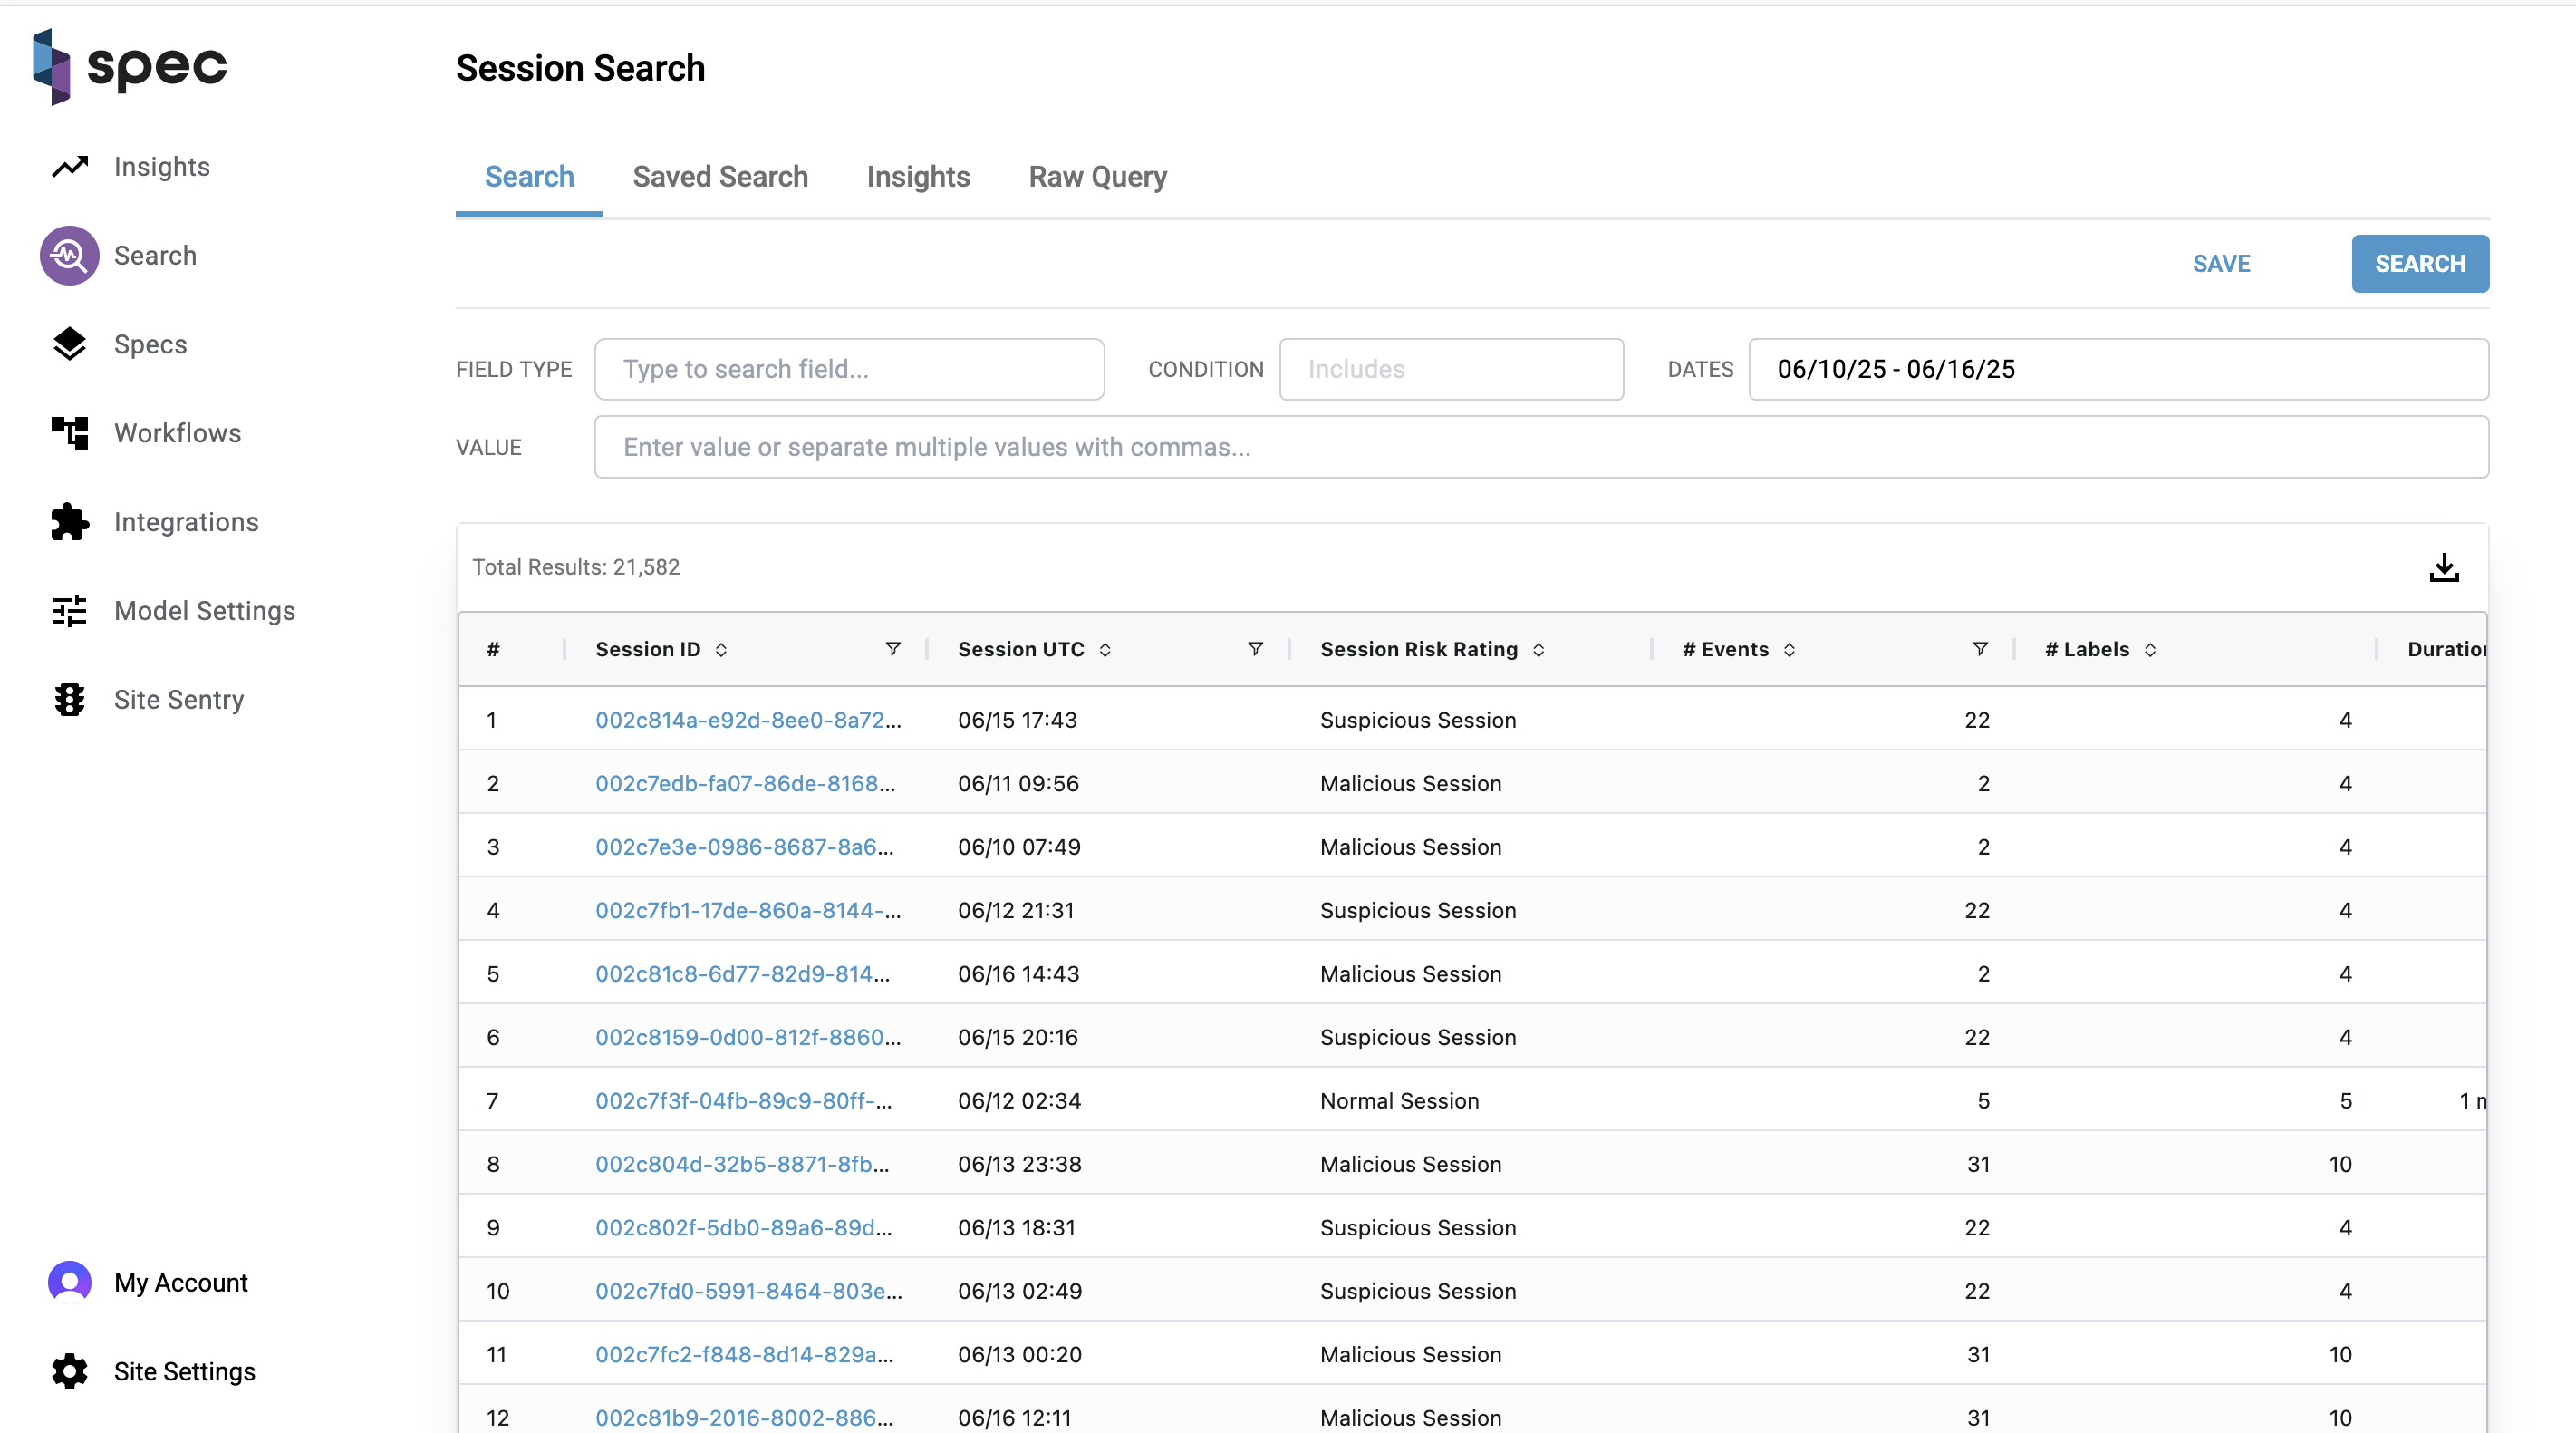
This page allows analysts to search through any session activity gathered by Spec. You can use this page as a launching point to find trends in user activity, save searches, download datasets, and continue to further investigate patterns made by fraudsters.
Columns
| Column | Explanation |
|---|---|
| Session ID: | Unique identifier for a session. Value hyperlinks to the User Session Assessment Page, where you can further investigate information gathered, events that occurred, and actions taken by Spec during the session. |
| Session UTC: | When the session was created. Can filter the result set by Date by using the date-picker input. Can further filter the results by clicking on the filter icon on the column, the right-most icon. |
| Session Risk Rating: | Risk rating for the session. Can be one of "Normal Session", "Suspicious Session", or "Malicious Session". |
| # Events: | Total number of events that took place during a session. |
| # Labels: | Total number of labels that were placed on a session. |
| Duration: | How long a session took place for. |
| Country: | Country a session took place in. Based on IP location. |
| City: | Identifying string for the device involved in a session. |
| IP Address: | IP address collected for a session. |
Run A Search
To run a search, change the input values at the top of the page and click "Search". These inputs allow you to search on a Spec element over a period of time and with any amount of values for the element separated by commas.
As an example let's say you only want to investigate malicious sessions within the past two weeks. You can do that by doing the following:
- In the "field type" input, choose the element type you want to search for (in this case, Session Risk Rating).
- In the "dates" input, choose a date range you'd want to limit your results to.
- In the "value" input, choose "Malicious Session".
Now you may want to see the malicious session with the most events involved. You can do this by clicking the sort button on the "# Events" column:
You can also filter your results even further if you click on the filter icon on a column. Continuing the example we've been using, I can copy the IP Address on the top row and filter results down to only the sessions where that IP was seen.
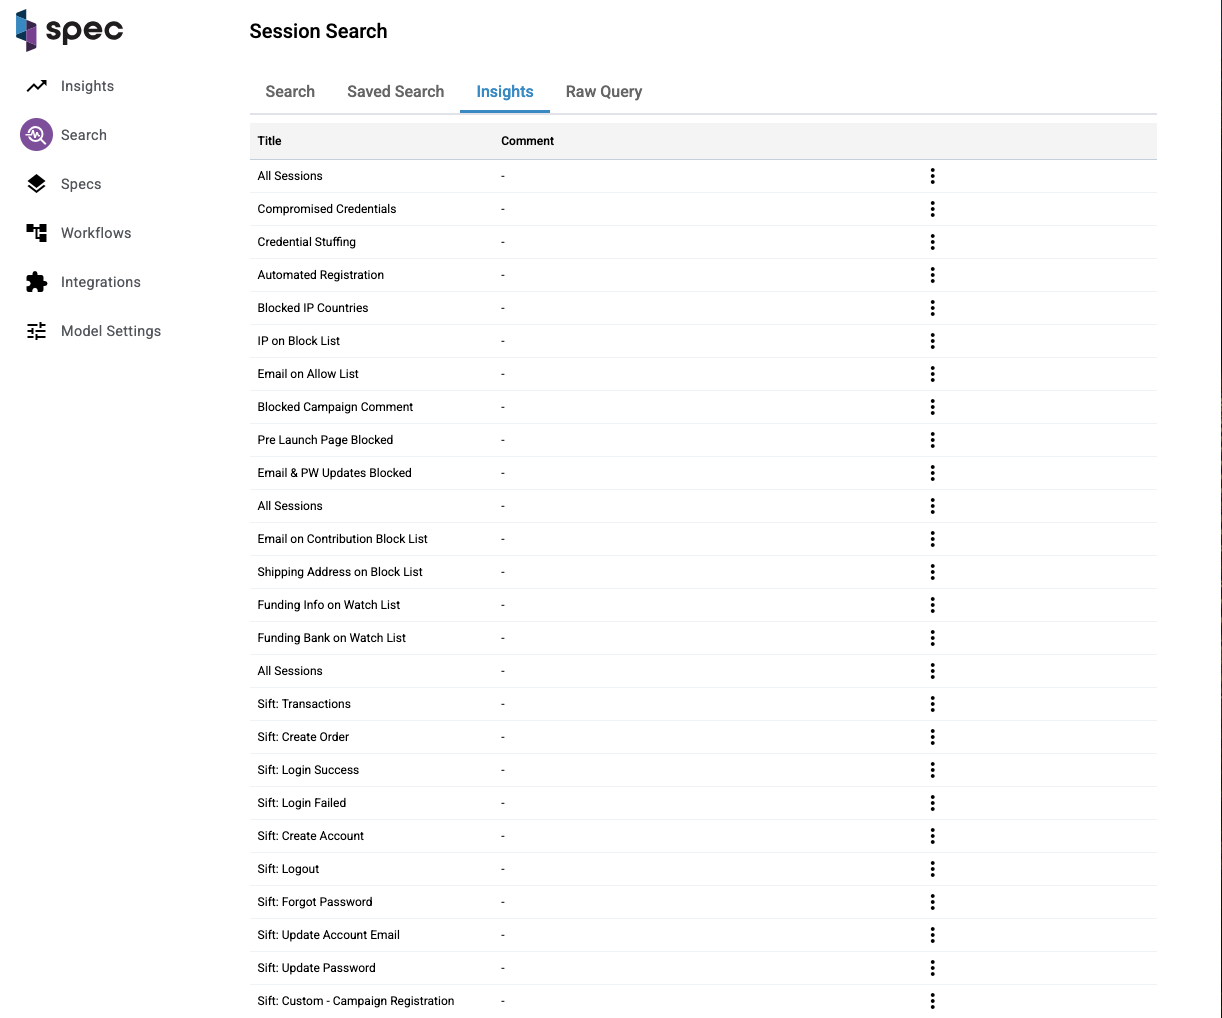
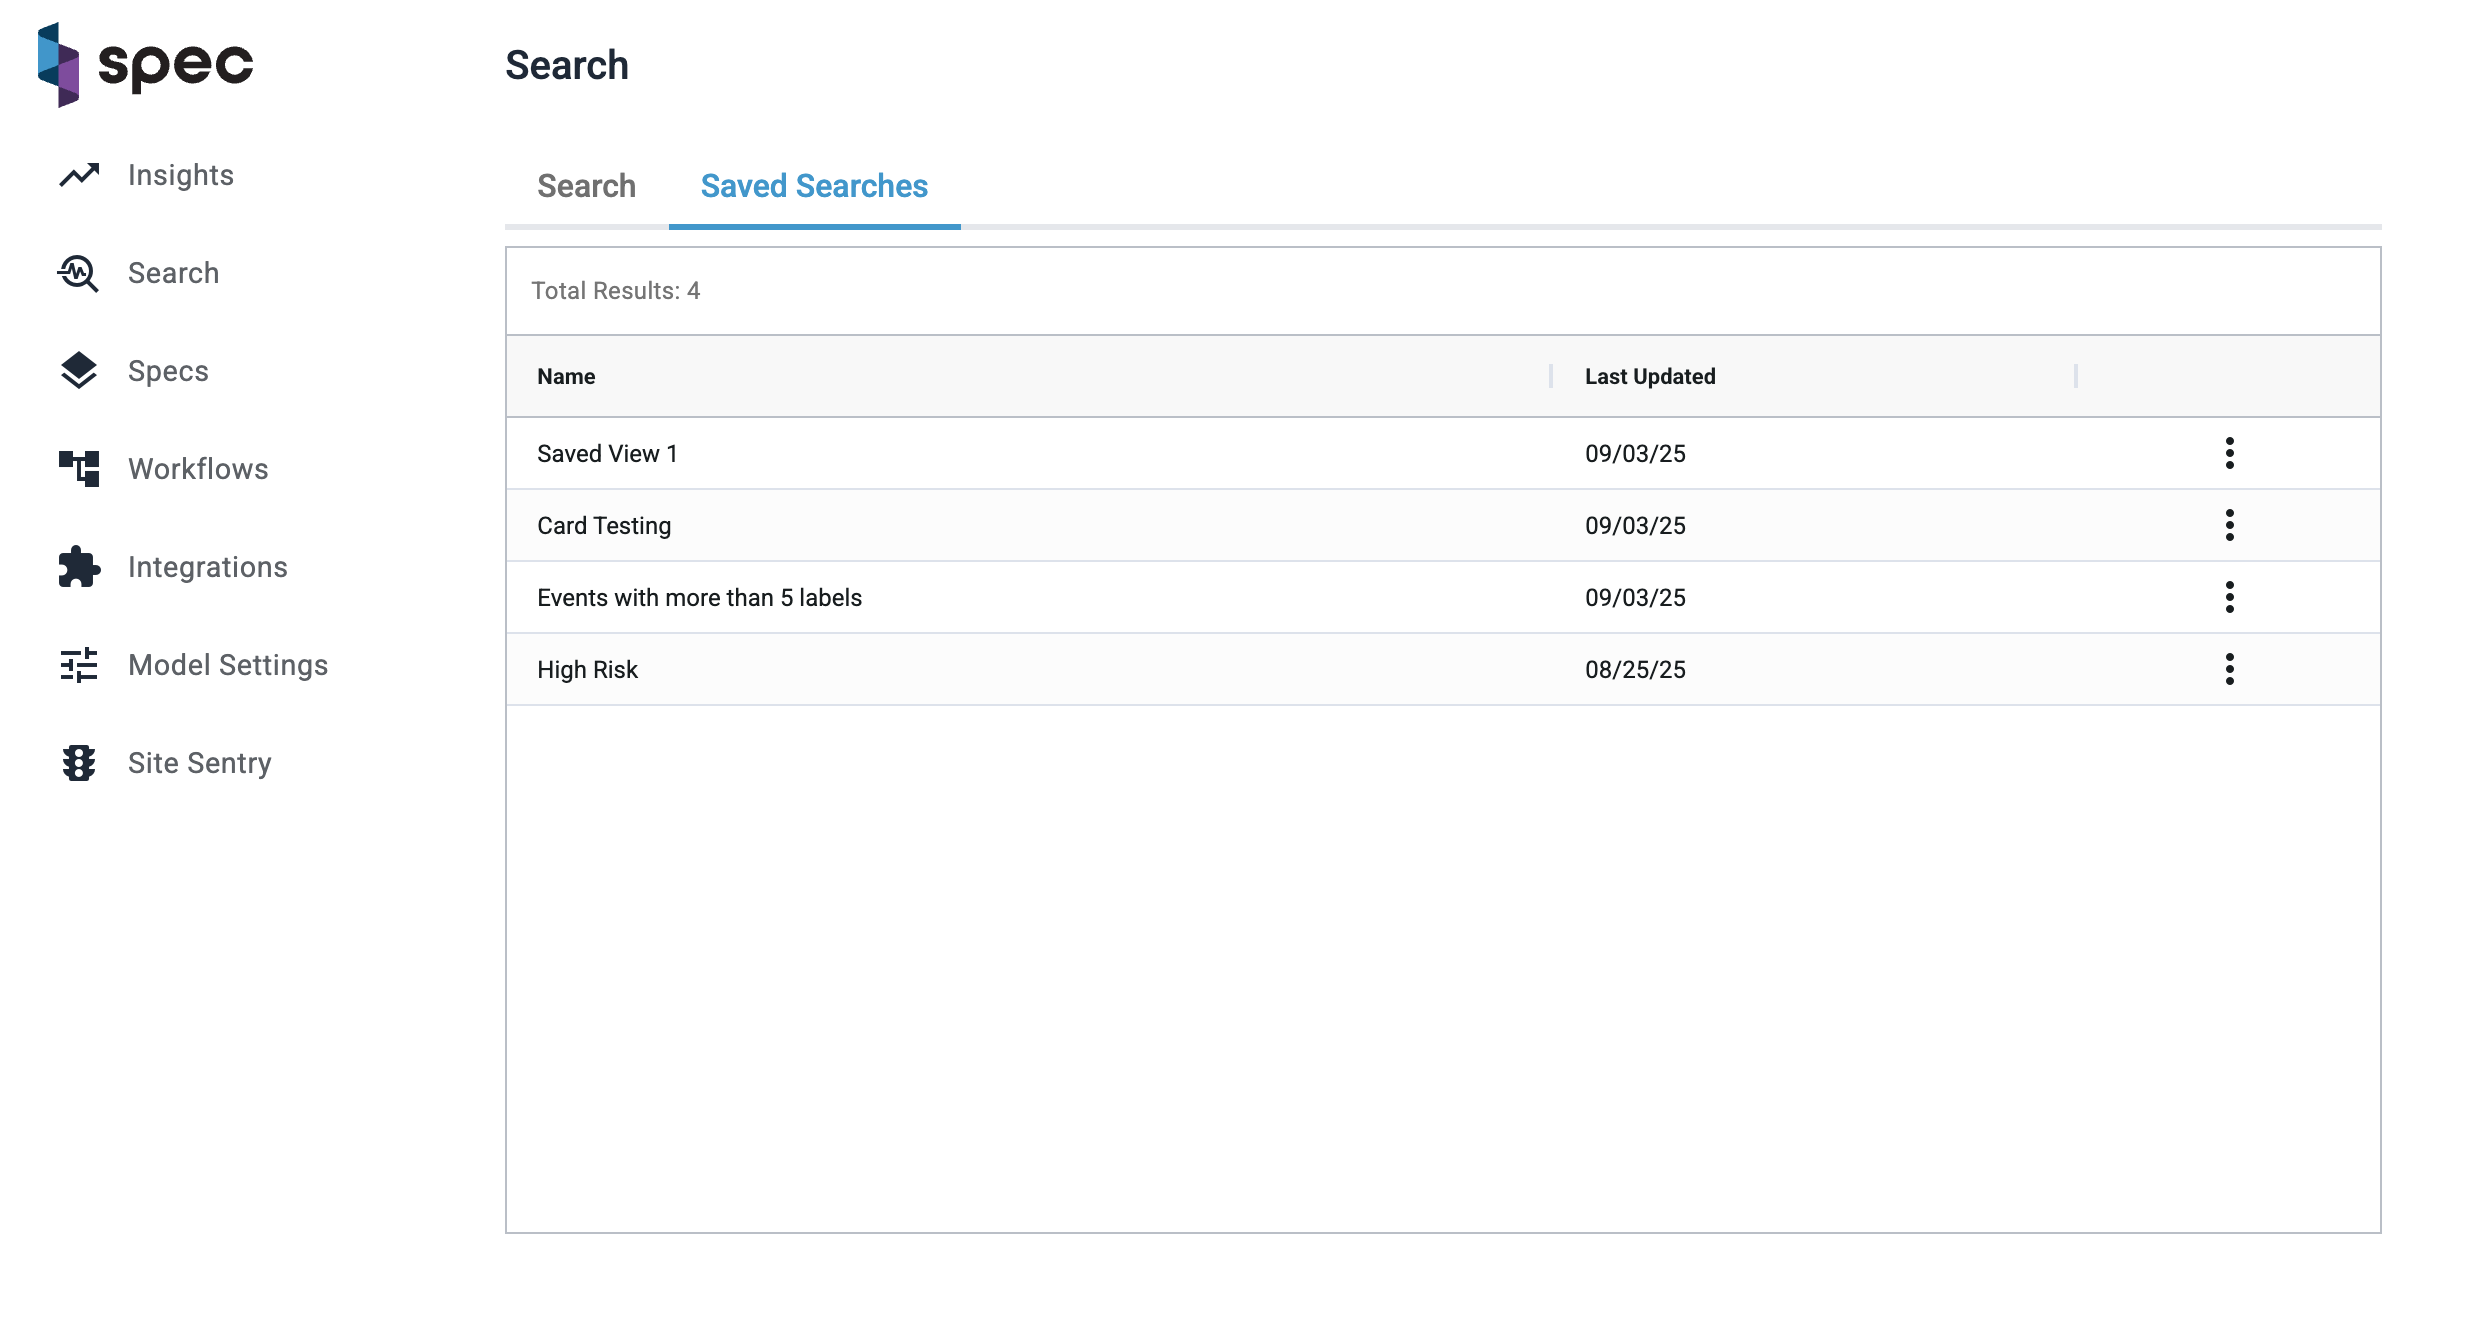
Saved Search And Insights Tabs
You have the ability to save any search you make. These searches will be listed under the "saved search" tab. To display the results of a saved search, click on a row and you'll be directed to the search tab with a list of the results.
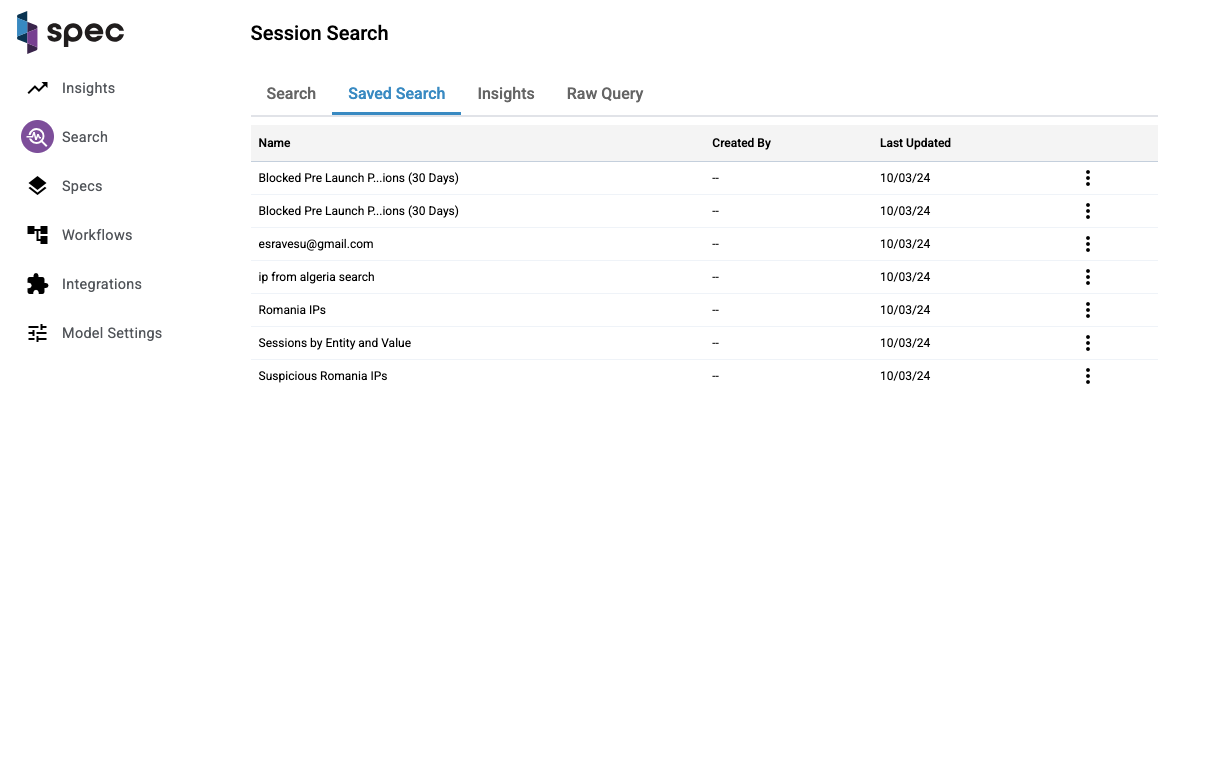
The same goes for the insights tab. Click on an insight on the table and you'll be directed to the search tab with the results.
Once you find the dataset you're after, you can download that data as a CSV. Click the download arrow on the top right corner of the table:
Digging into a Session
Clicking on a link under the "Session ID" column will take you to the User Session Assessment Page, where you can find more details on a specific session. Go to that page to read more.
Event Search
Search and investigate individual events — without digging through sessions.
Event Search is designed for fast, targeted investigations. Instead of navigating full user sessions, you can now query and explore events directly — with filters, saved views, download options, and links into your investigation workflows.
Goal
Find and investigate specific events across your customer traffic using structured filters, a sortable table, and inspector-level visibility — without needing to open every session.
What You Can Do with Event Search
- Search for events across all sessions with flexible filters
- Filter by event type, label, signature, entity values, and more
- Save and share views and filtered data
- Link directly to event, session, or entity pages
- Export data for offline analysis
- Flag patterns for deeper review
Getting Started
1. Navigate to the Event Search Page
Head to the Search tab from your main navigation panel.
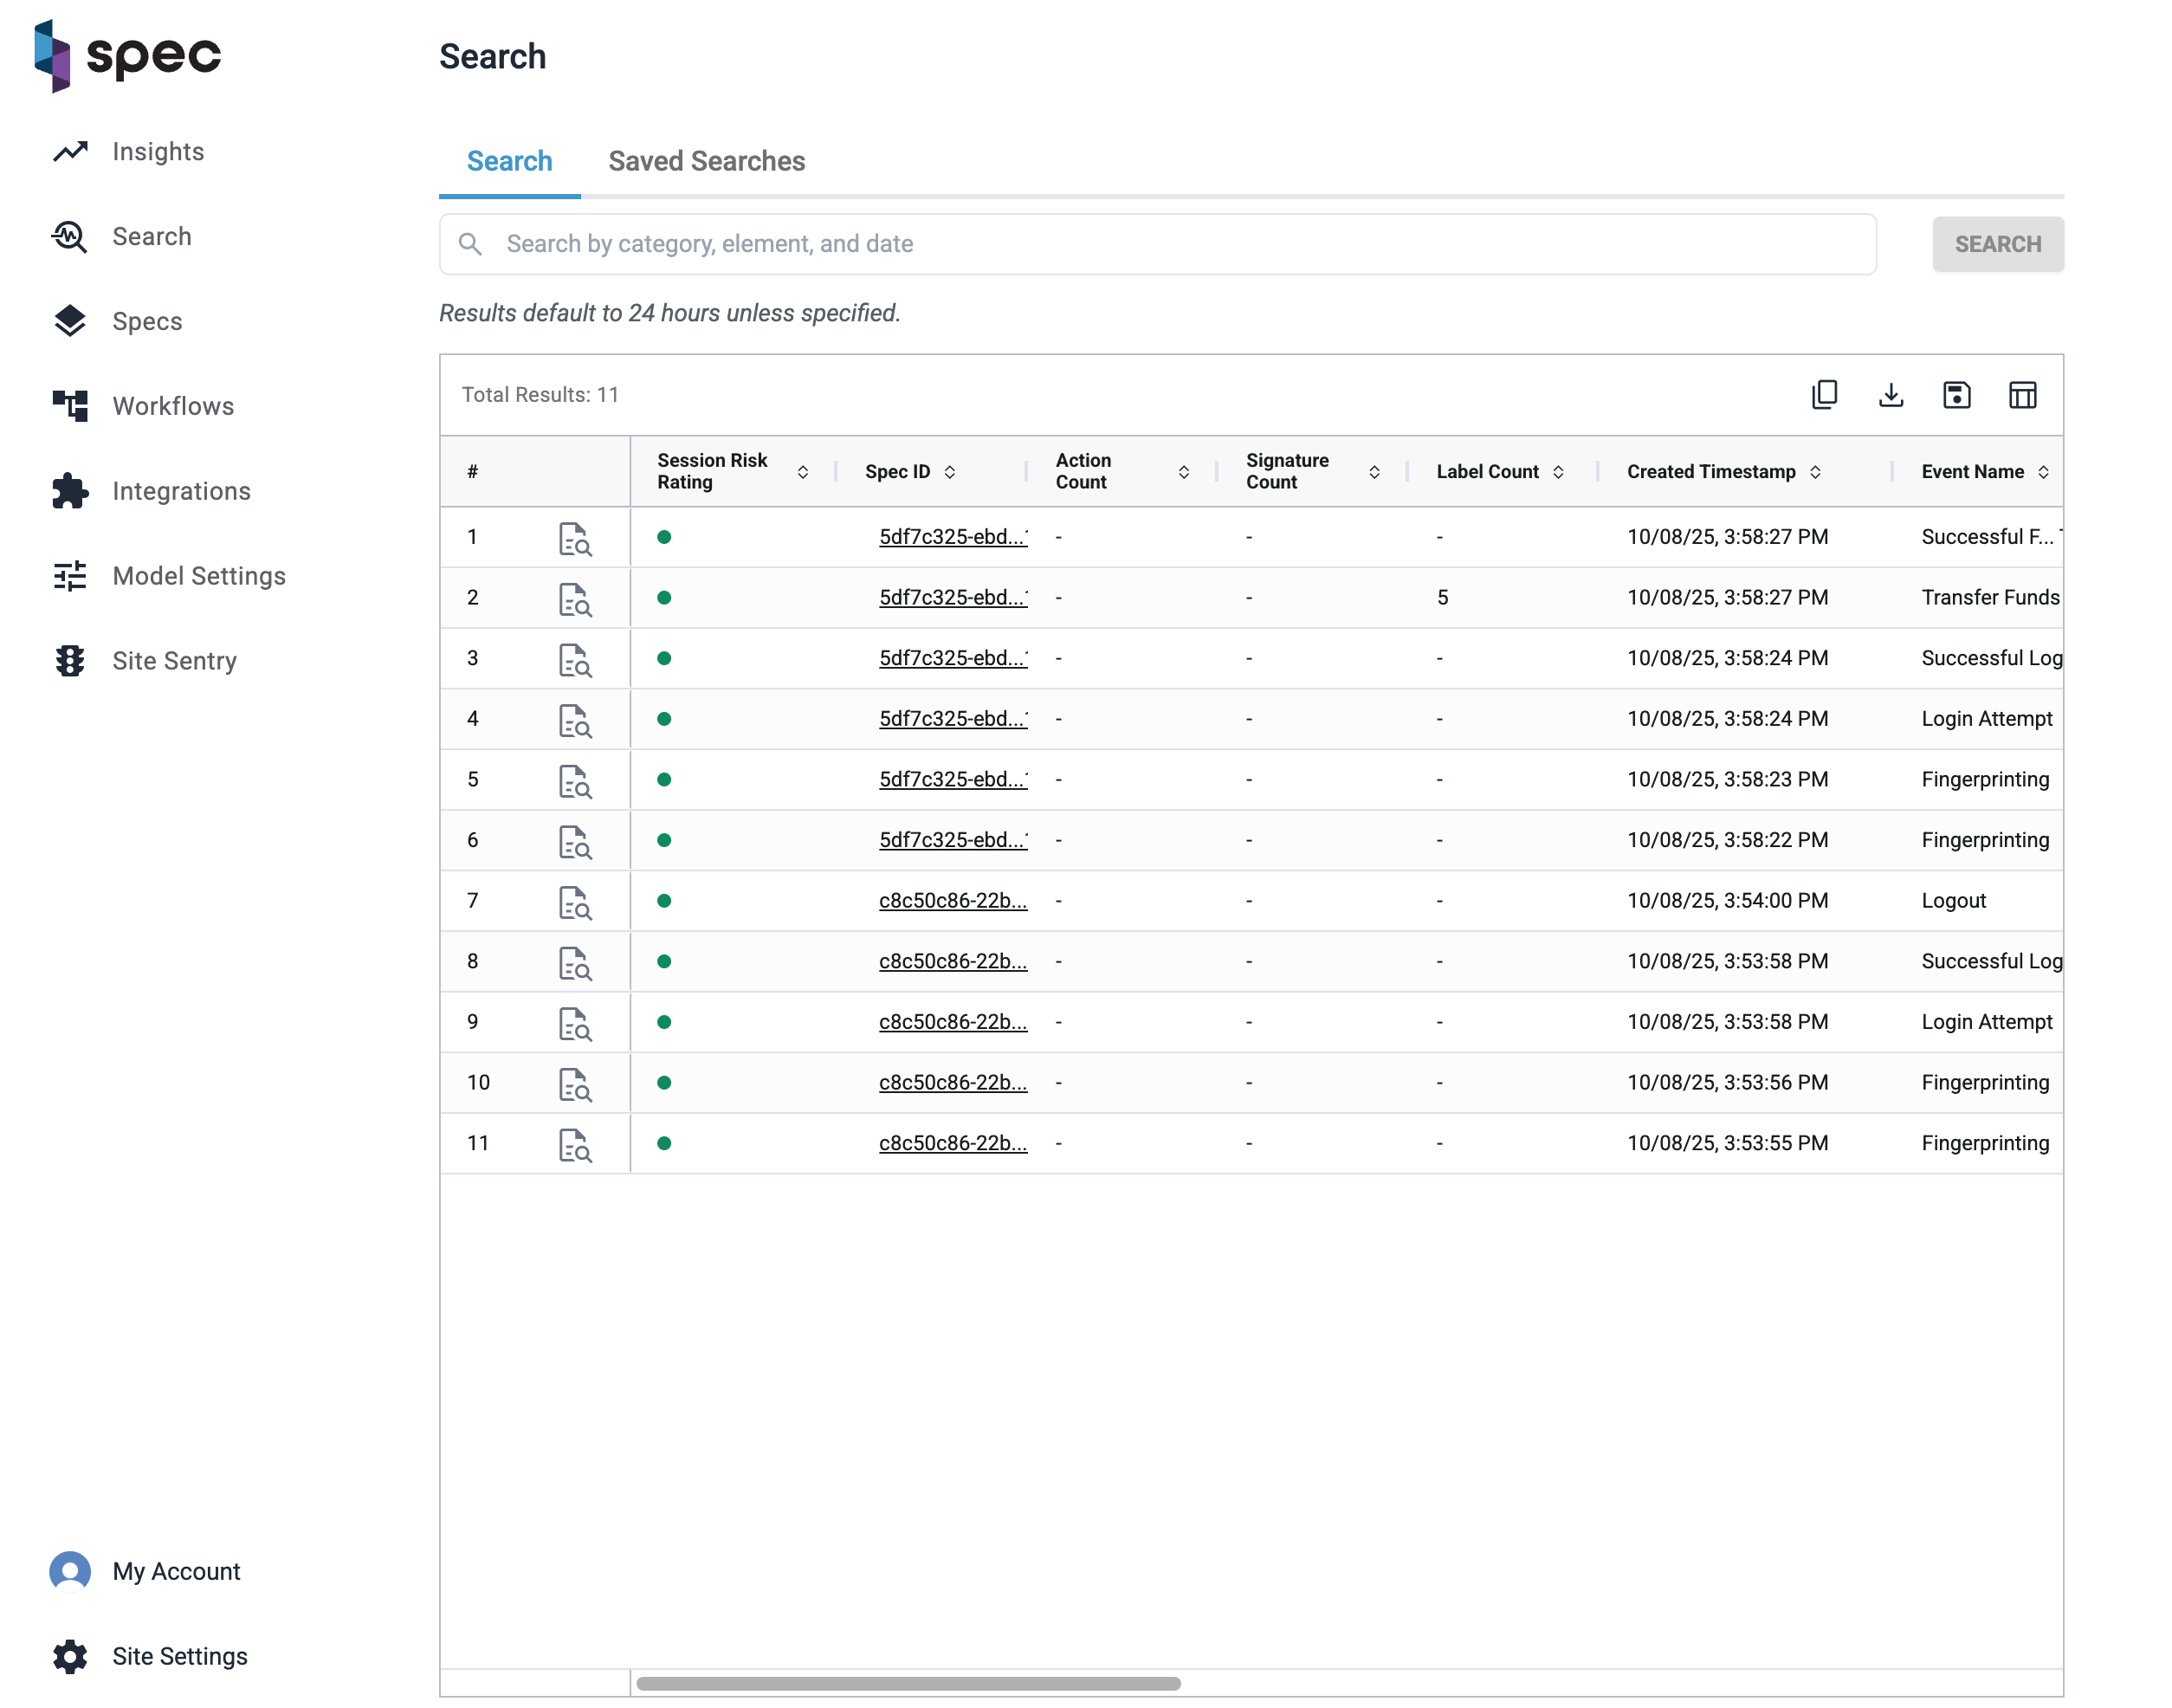
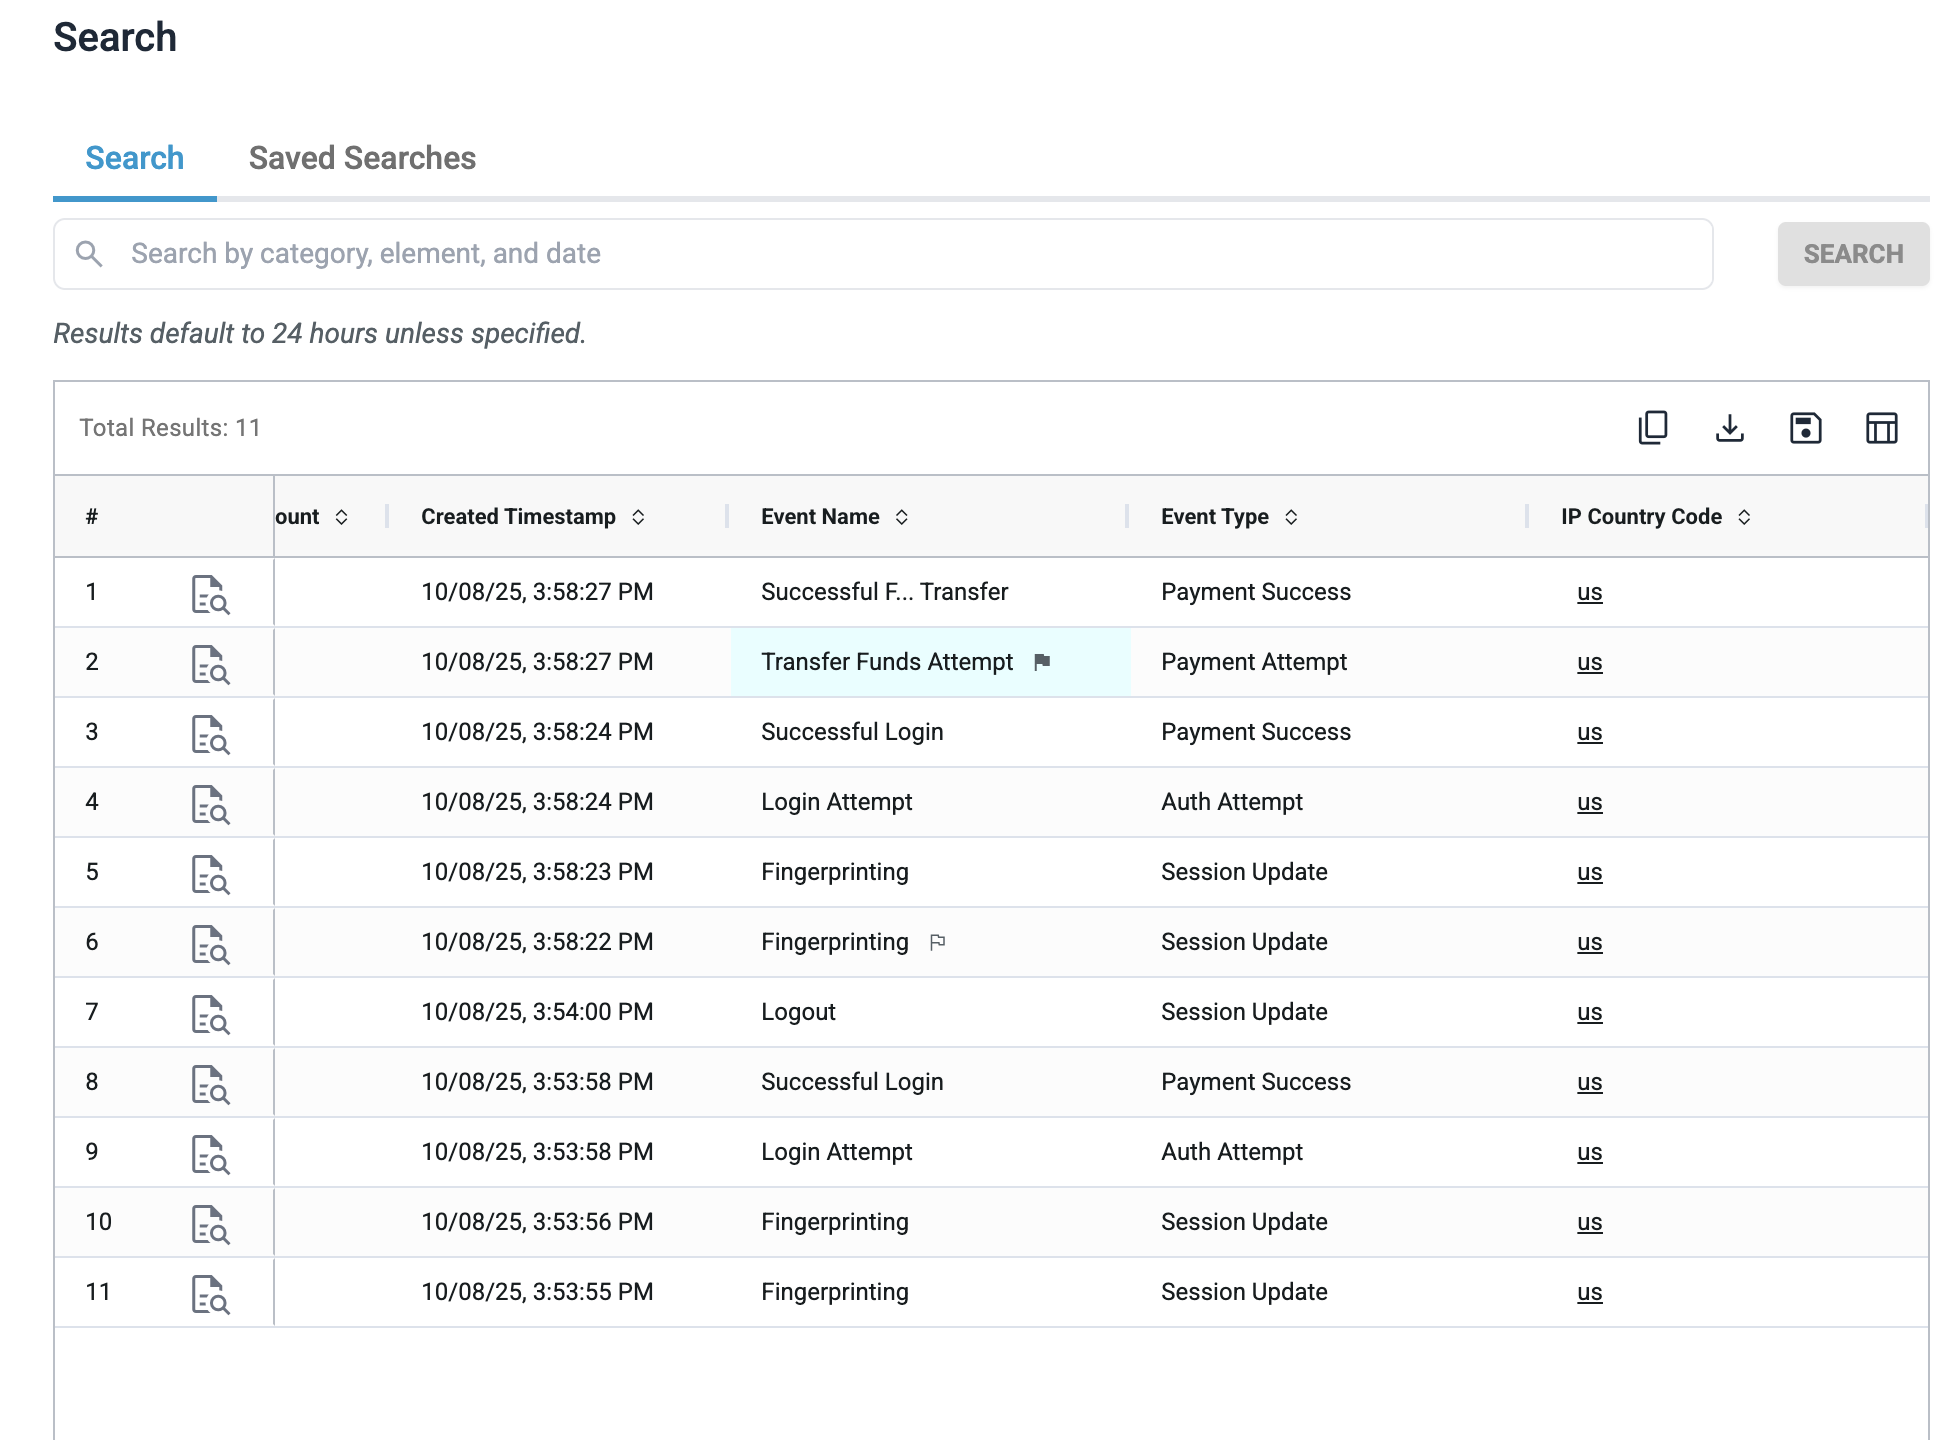
Example of Event Search with selected columns applied.
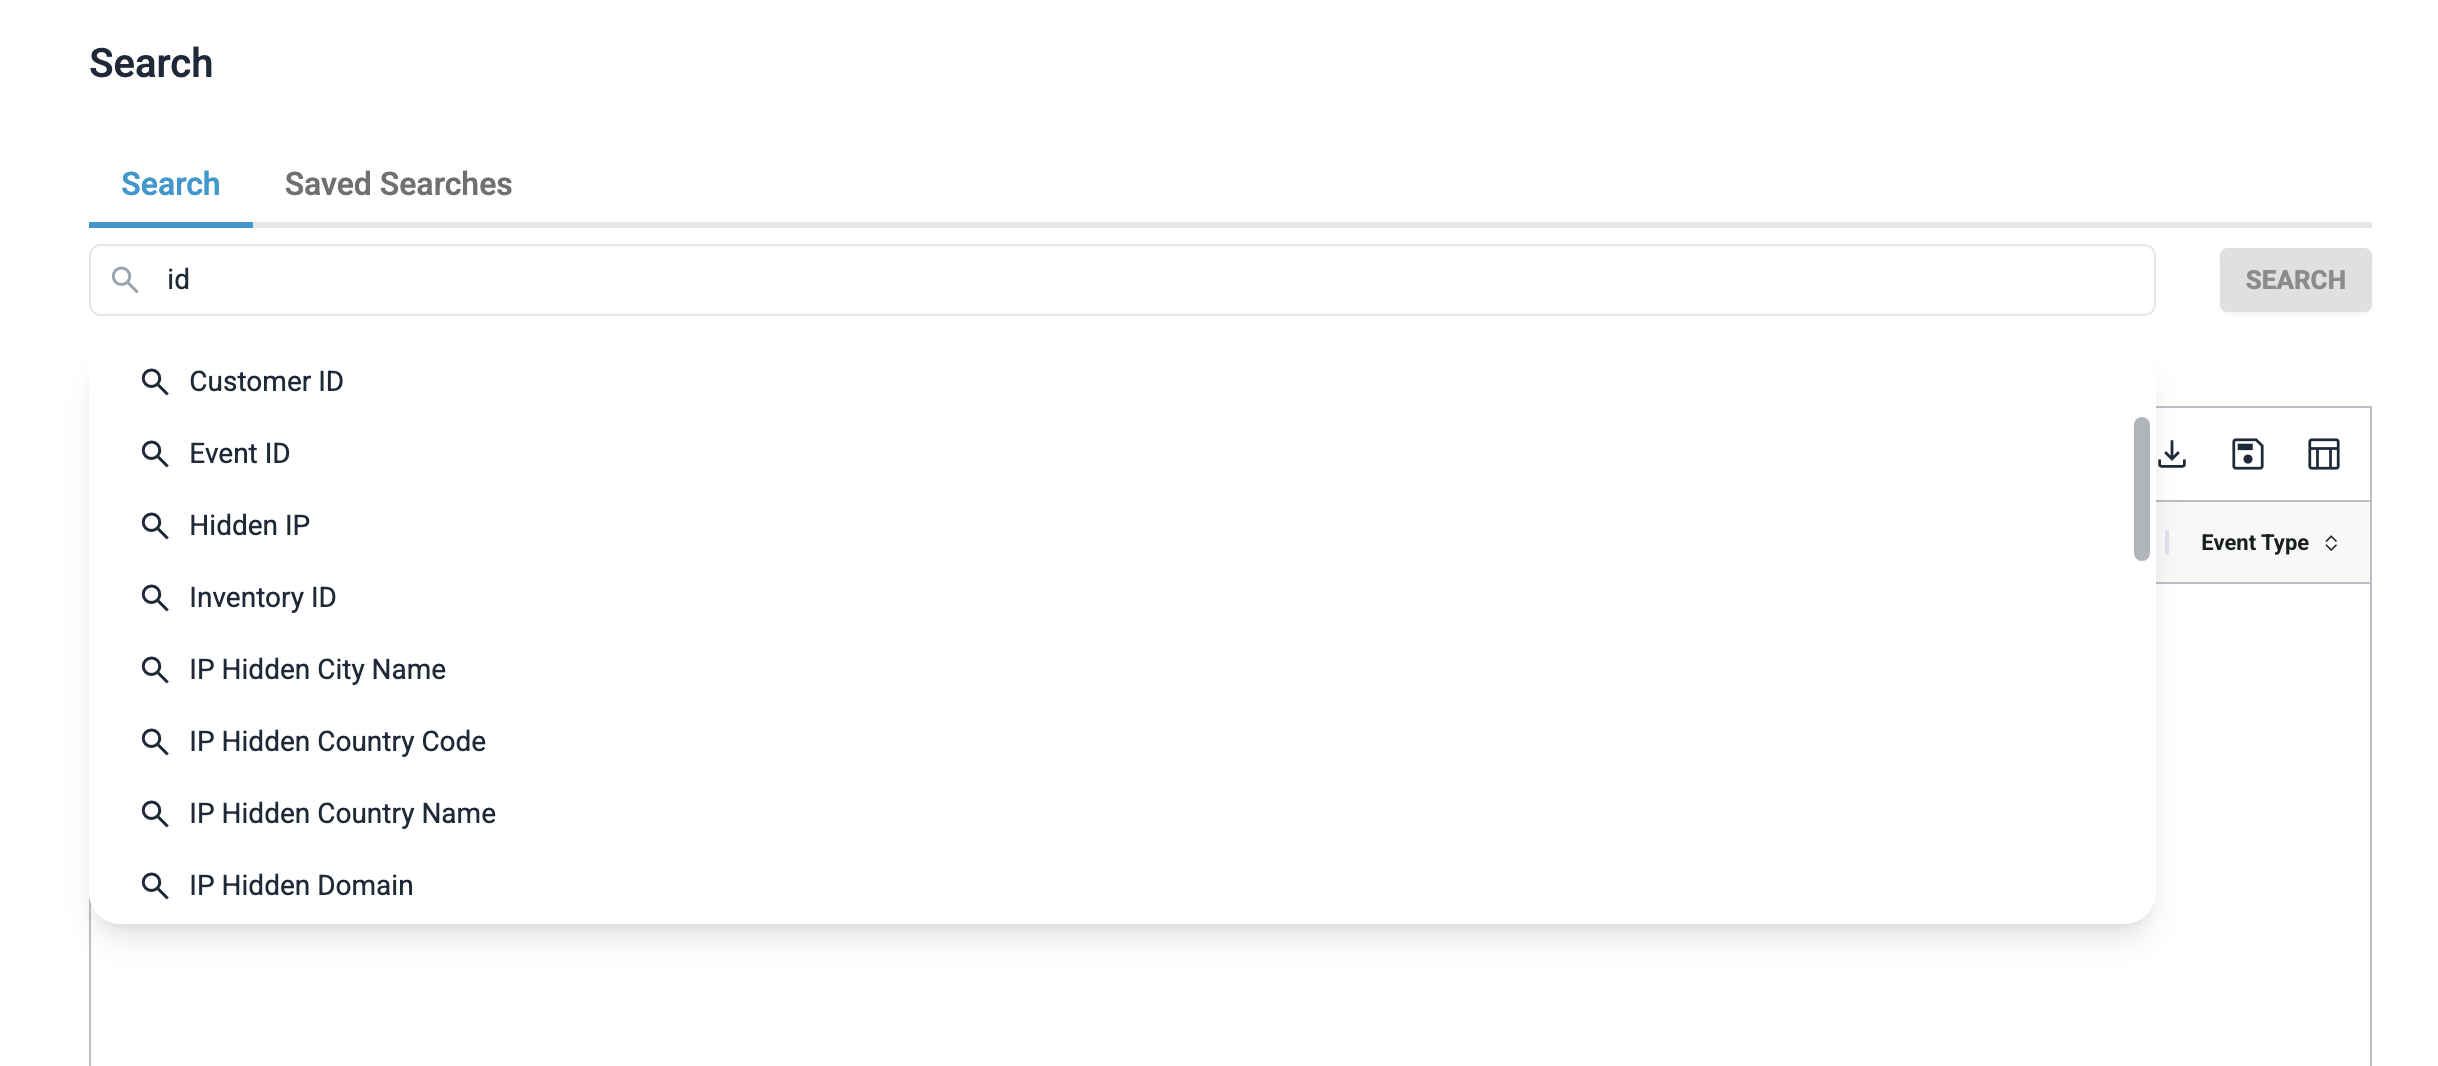
2. Use the Search Bar
Enter structured queries using key:value format. For example:
event: Refund Successemail: johndoe@email.comaction_count: >=5date: "2025-07-01"-"2025-07-08"
As you type, the search bar will guide you with auto complete for fields like risk level, event types, or country codes. Hit "Enter" to finalize a filter value.
Each filter you apply becomes a pill that appears in the search bar and is reflected in the table. Each pill can be edited or deleted.

Date format and validation
- Format (UTC):
YYYY-MM-DDorYYYY-MM-DD hh:mm:ss- Optional operators:
>,>=,=,<=,<> - Example:>2025-02-02- For ranges, use quotes:
"2025-02-02" - "2025-02-03 02:00:00"- Data is available for the previous 365 days
- Maximum range permitted: 90 days
- Results default to the last 24 hours unless specified
Customize Your Table View
Click the Column Picker to choose which fields to show in your results. You can:
- Add or remove columns
- Sort by any column
- Freeze (pin) up to 4 columns
- Rearrange columns by drag-and-drop
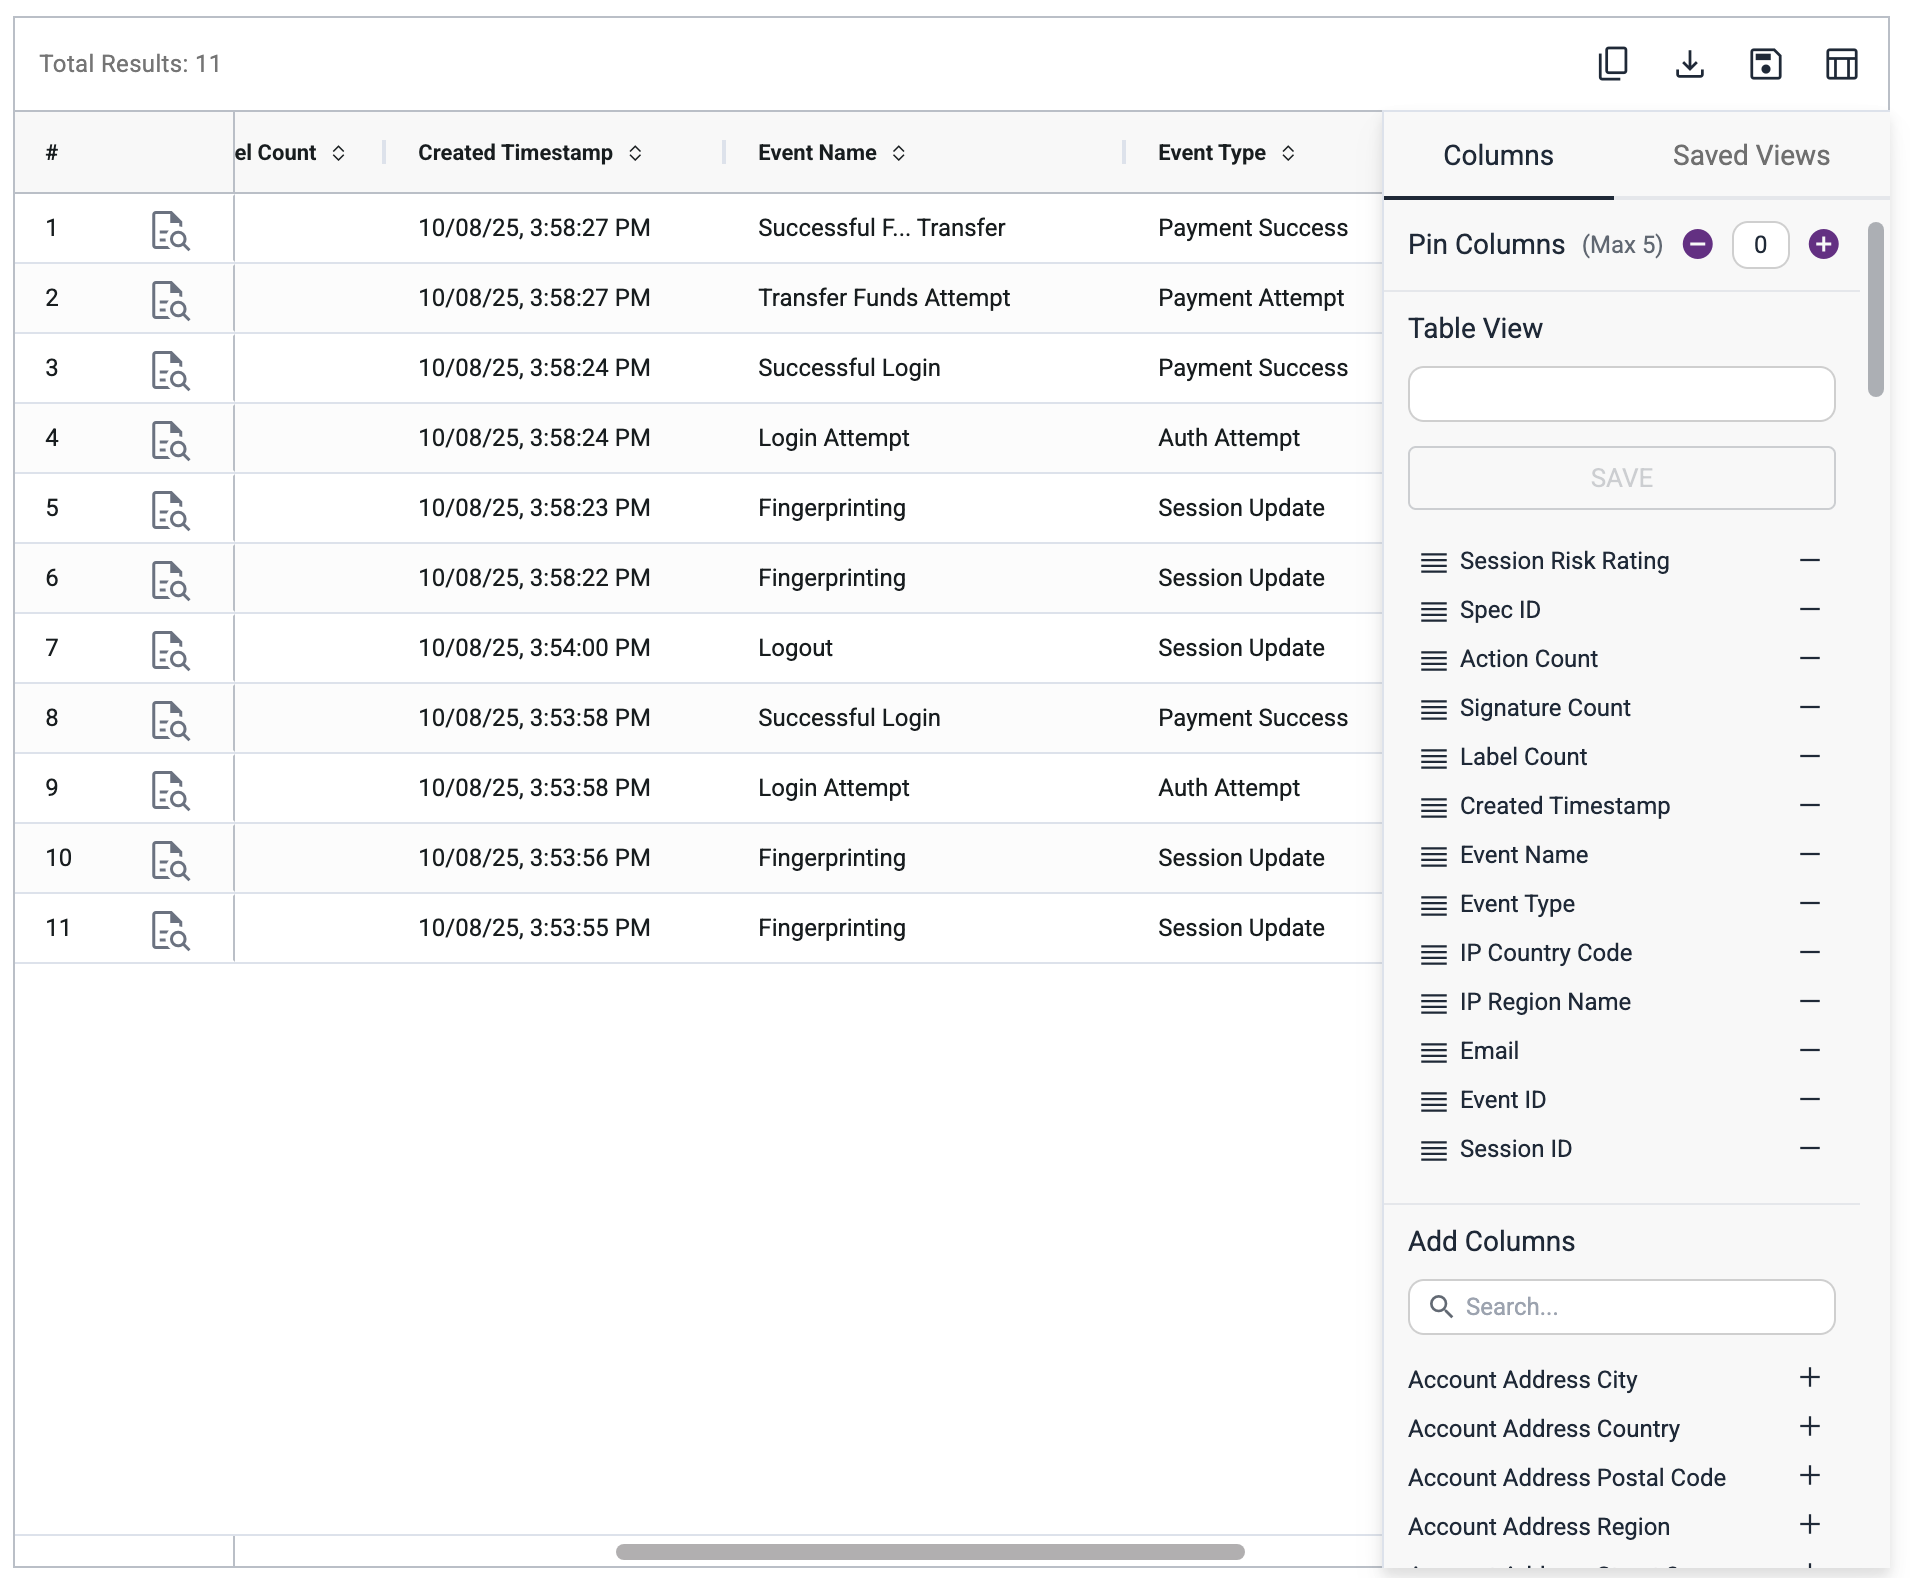
Once you've tailored your table view, you can save it for later use. All saved views are available under "Saved Views" tab in a column picker sidebar.
Save & Share Search
When you’ve built a search you’ll want to revisit:
- Click the Save icon in the top-right.
- Enter a title for your search in the modal window.
- Click Confirm.
You’ll see a success toast, and a new search would be available at "Saved Searches" tab.
Access Saved Searches
To access saved searches:
- Open the Saved Searches tab at the top of the Event Search page.
- Browse the list of saved searches.
- Click any row to load the search.
You can also:
- Copy links to share a saved search
- Delete searches you no longer need
- Edit a saved search or use it as a base to create another saved search.
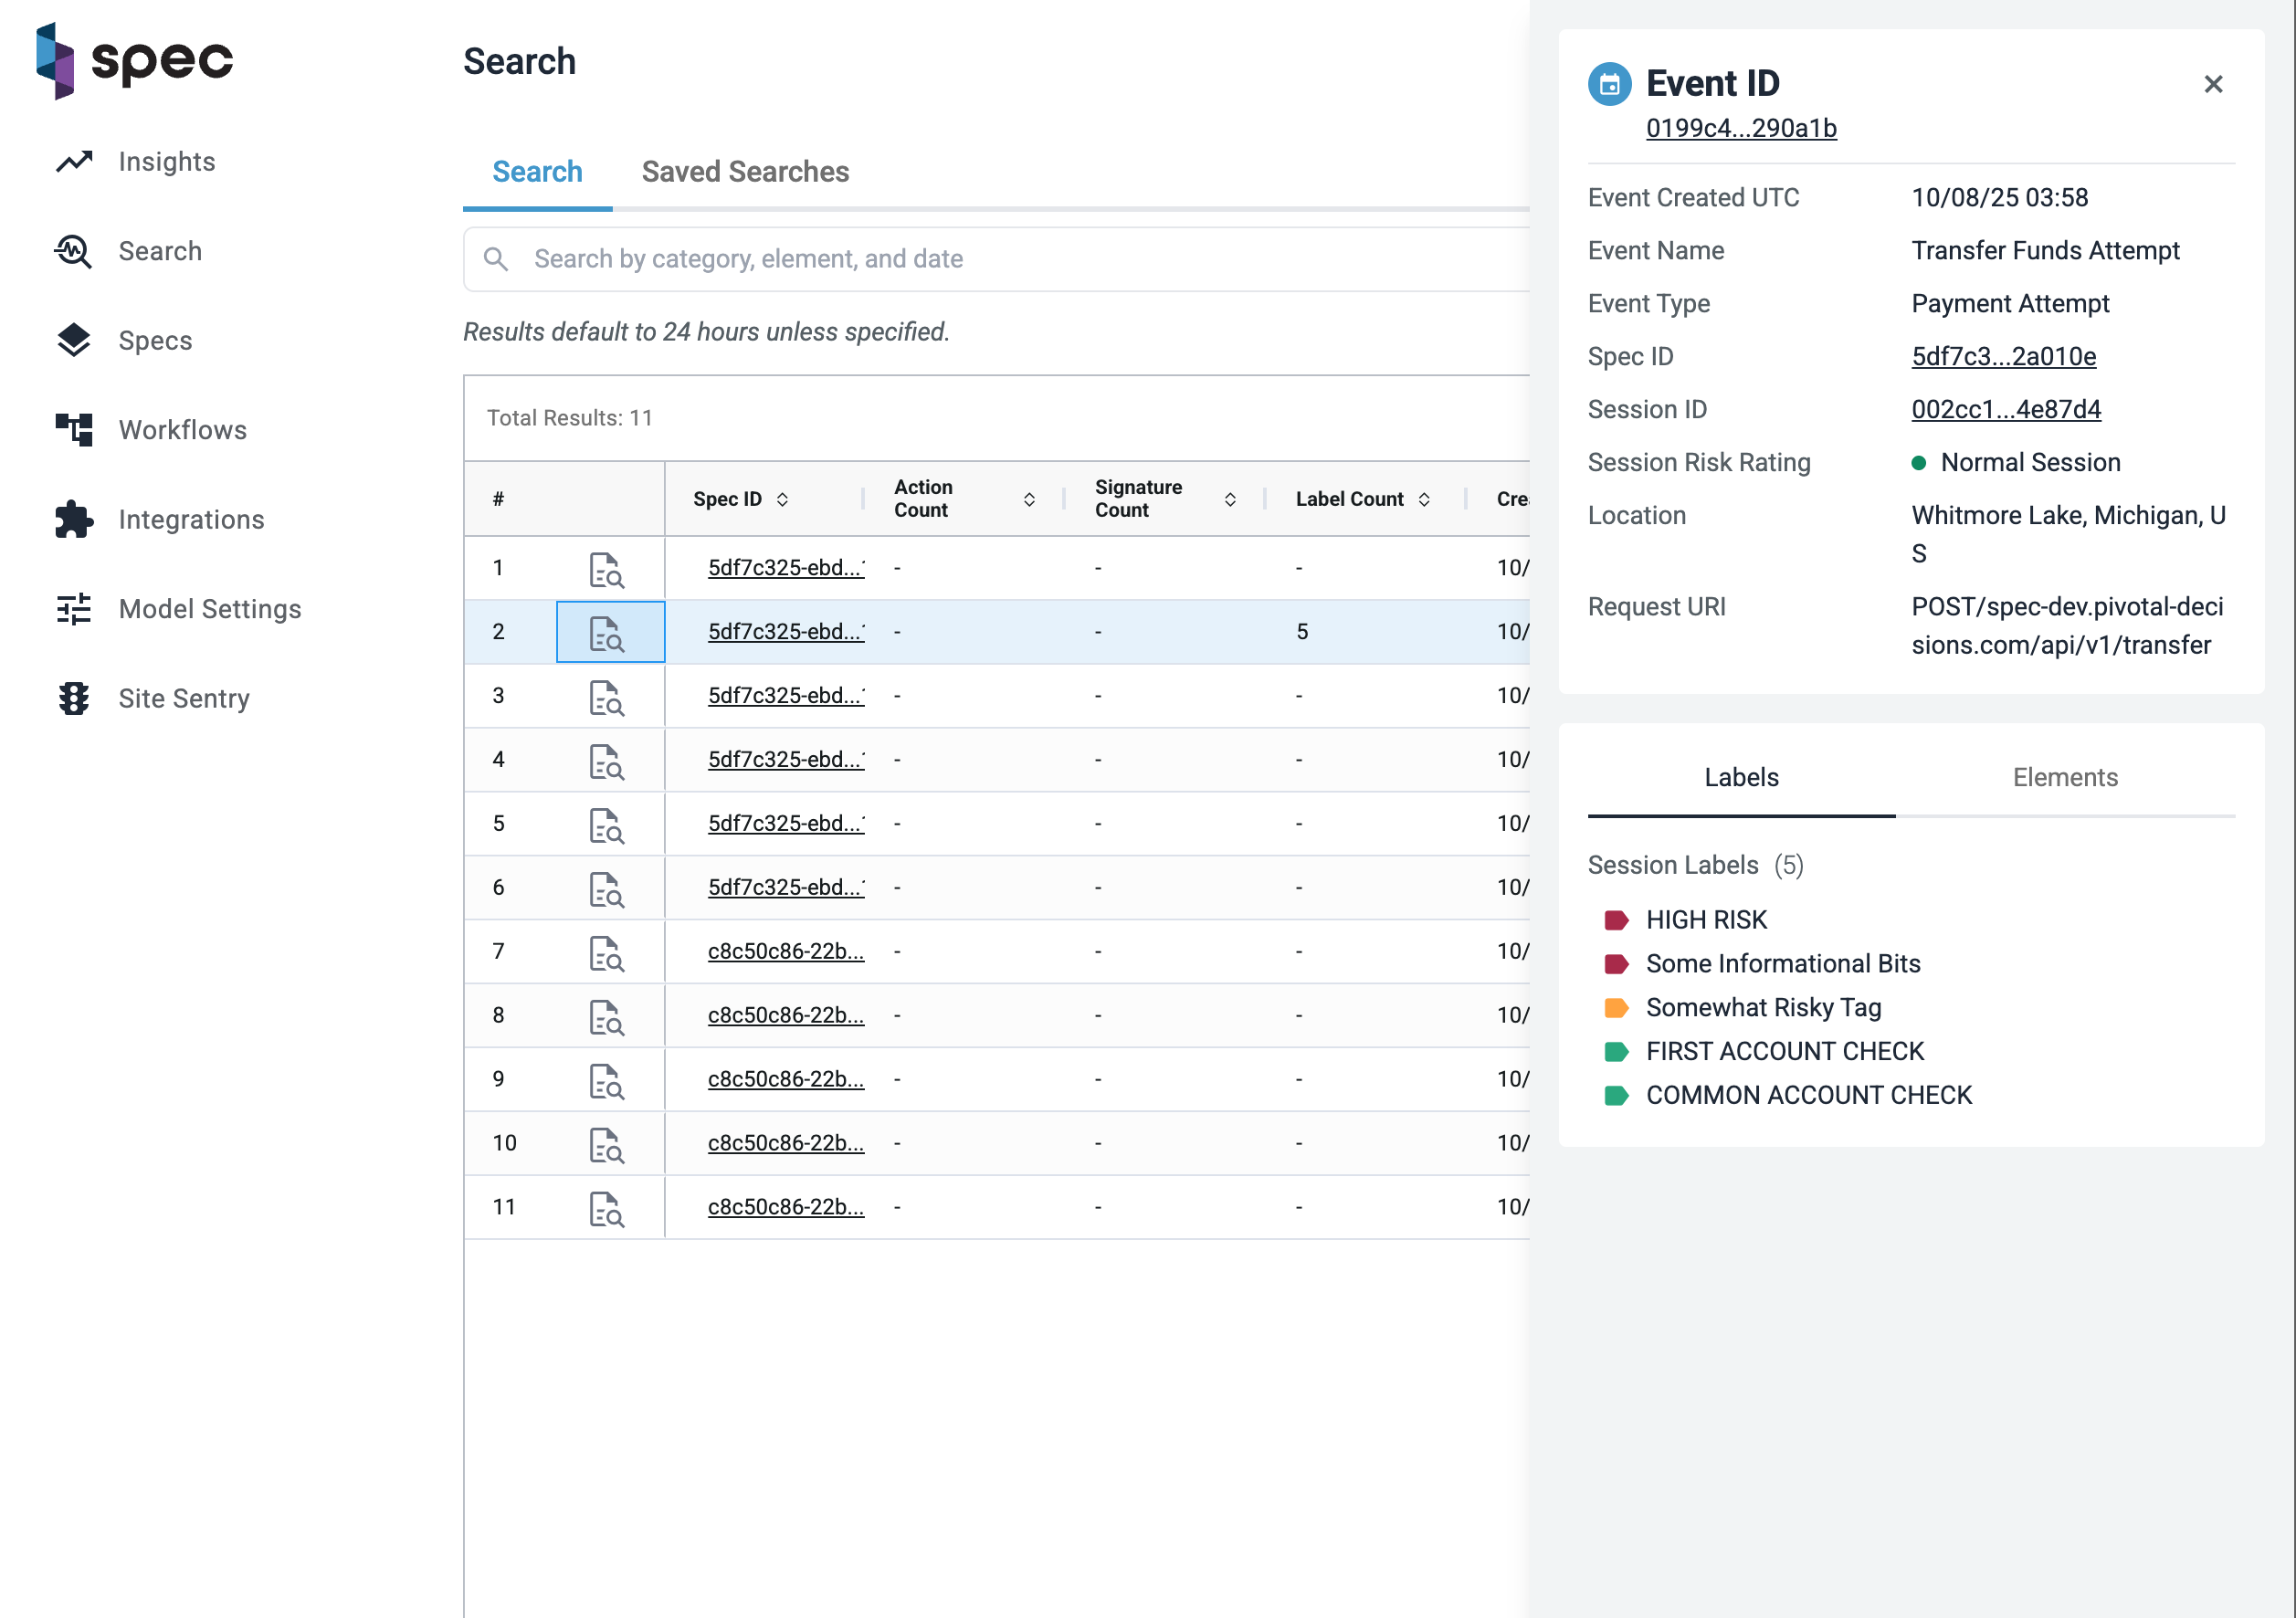
Click Into Details
From the Event Search table, you can:
- Click on an Event ID → opens Event Inspector
- Click on a Session ID → opens USA Page
- Click on an Entity → opens EB&L Inspector
Or, if you want to stay in context without navigating away, you can use the Event Flyout to preview key event details inline.
To open the flyout, click the magnifying glass icon in the row of the event you’re interested in. This lets you explore high-level information like risk, actions, entities, and more — without leaving the page.
Flag and Highlight Patterns
Hover on a value within the table (e.g., a specific signature) to flag it, which highlights matching values across the table. This helps you identify clusters or anomalies at a glance.
Export Your Results
Want to dig deeper or share offline?
- Use the Download CSV option to export your current search results.
Pro Tips
- Your filters are URL-based — you can copy the page URL anytime to share your current view.
- Search includes support for operators like
>=,=, and partial matching. - Browser navigation (back/forward) is supported — you won’t lose your table settings and filters.
Event Search makes investigations faster, clearer, and more precise.
Find what matters — instantly.
User Session Assessment Page
High Level Overview
While the Search page focuses more on sessions (Event Search coming soon!), the User Session Assessment page focuses on the events within a session. This page tells Spec customers a story about what the user accomplished (or tried to accomplish) during a session.
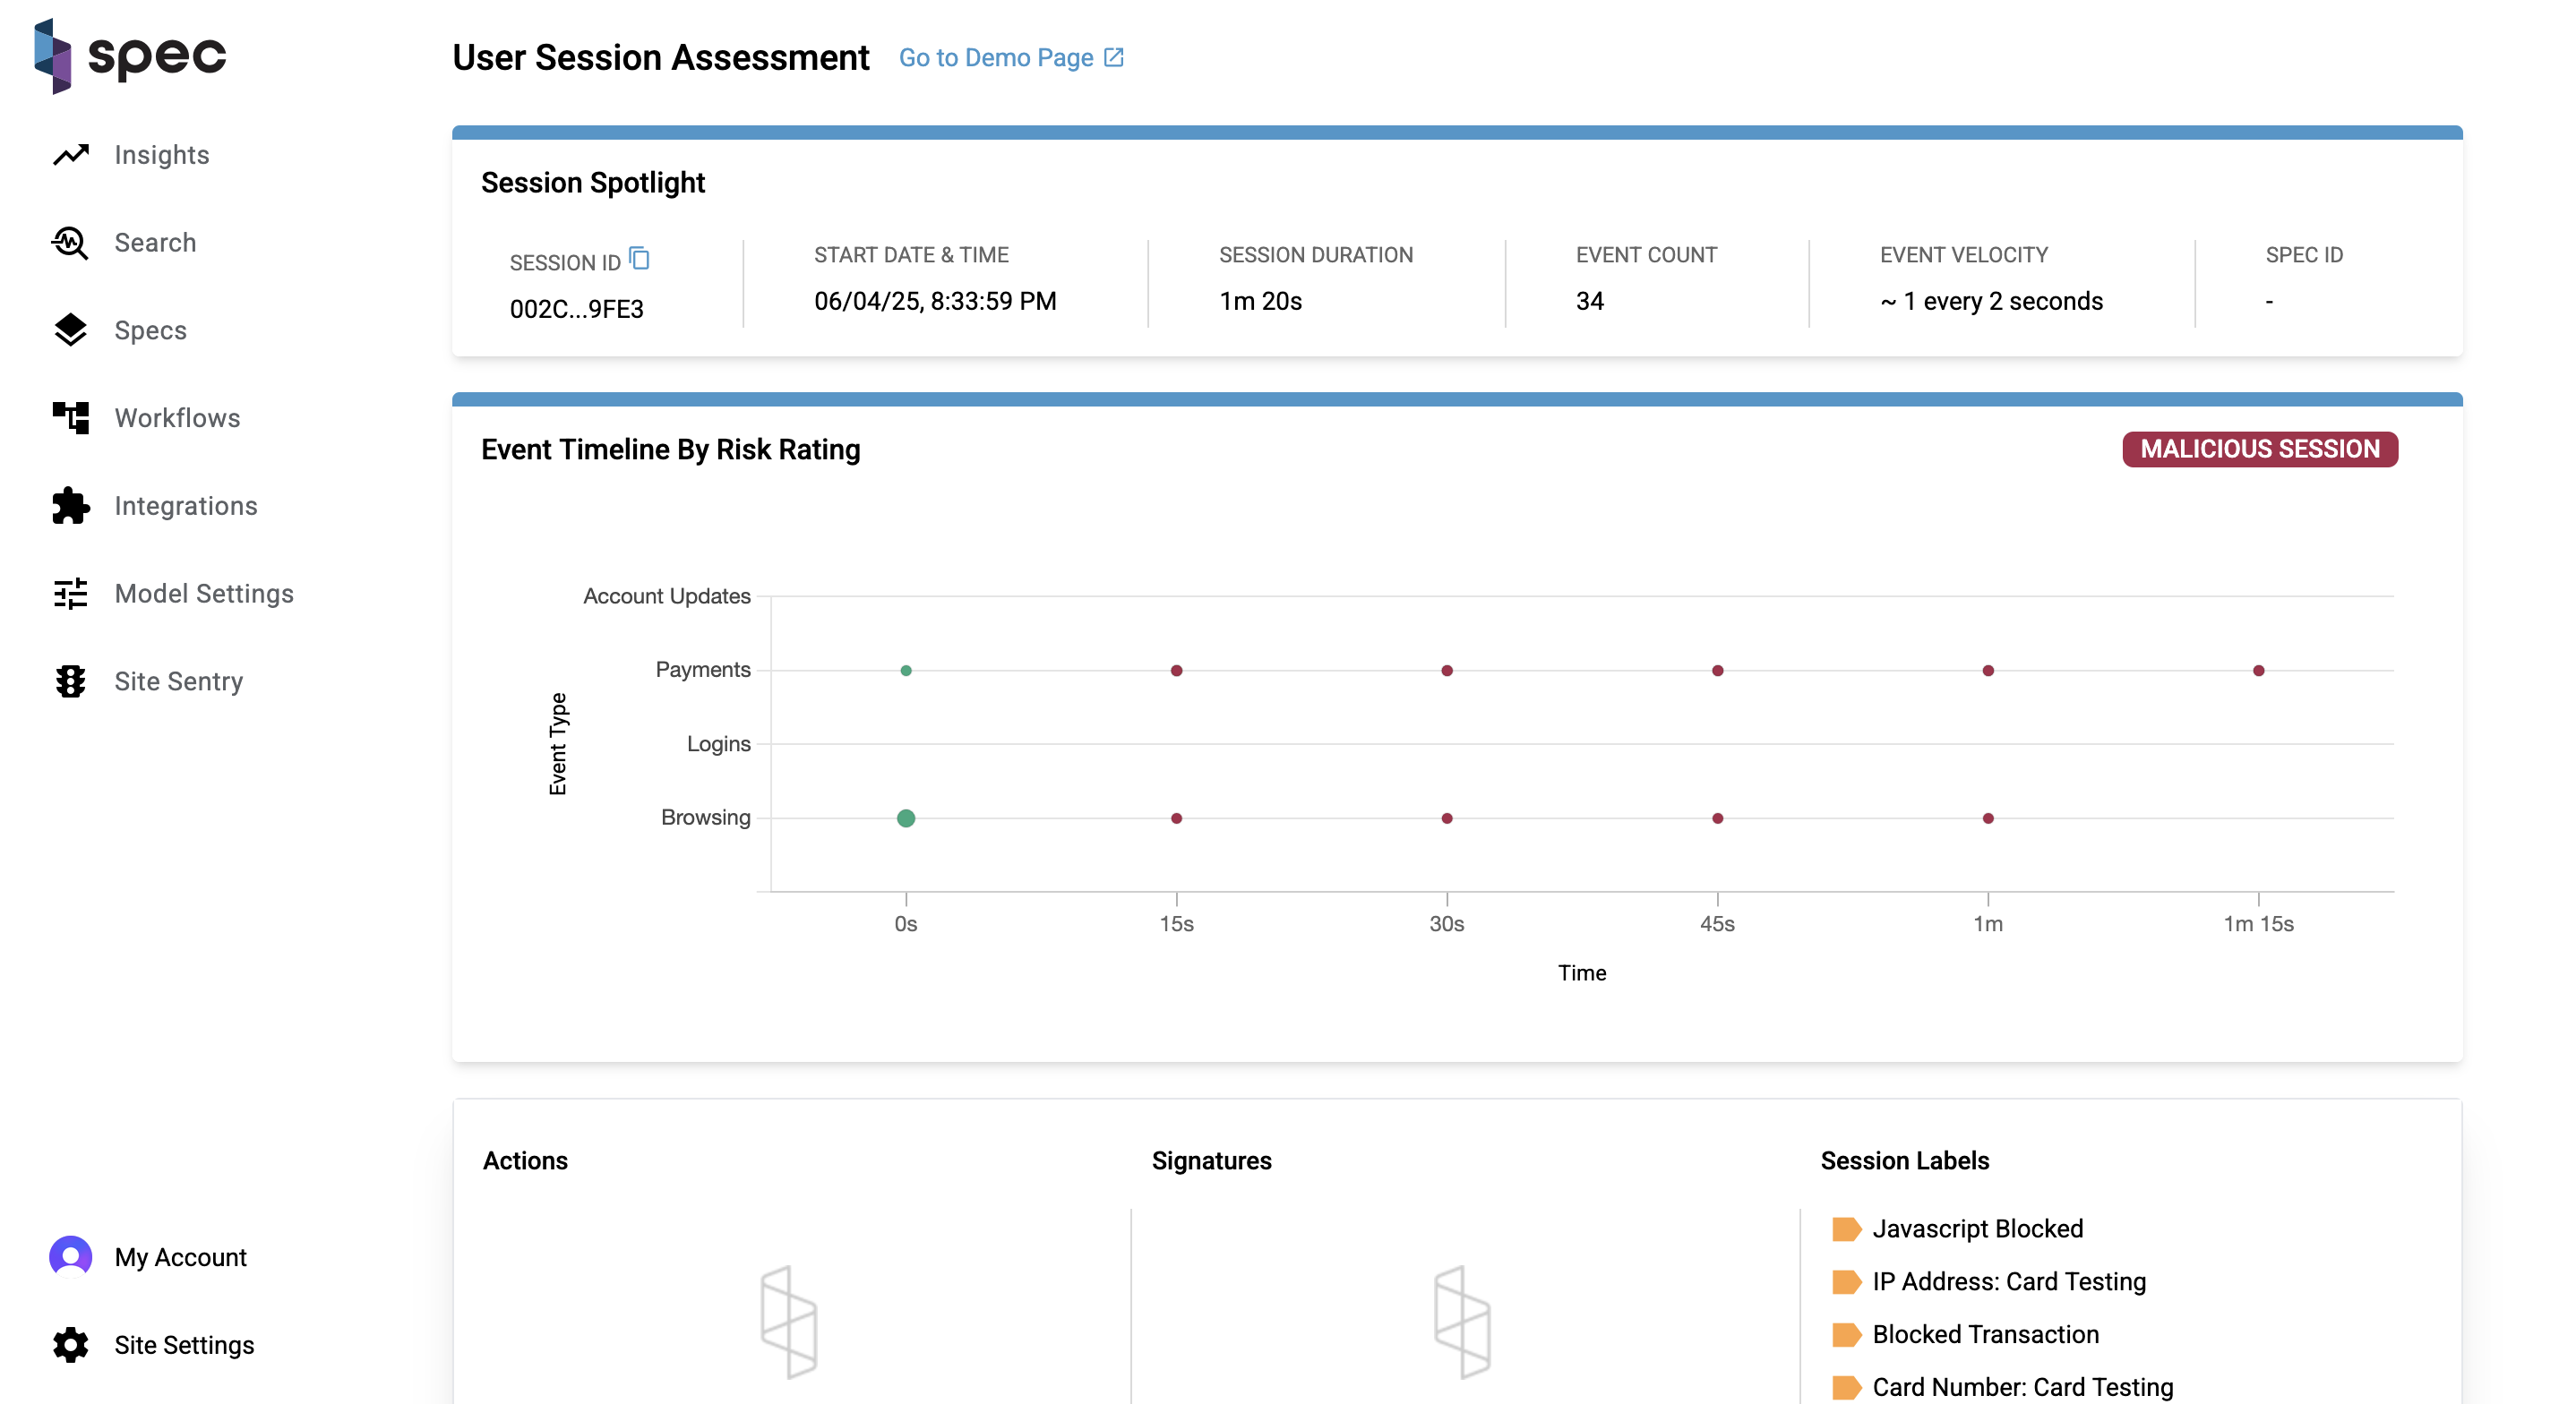
Session Spotlight
The spotlight highlights key data points about a session. These include:
- Session ID: Each session is attributed a unique identifier.
- Start Date and Time: When the session started.
- Session Duration: How long the session lasted.
- Event Count: How many events took place during the session.
- Event Velocity: The rate of events in the session.
- Spec ID: An element that links sessions together.
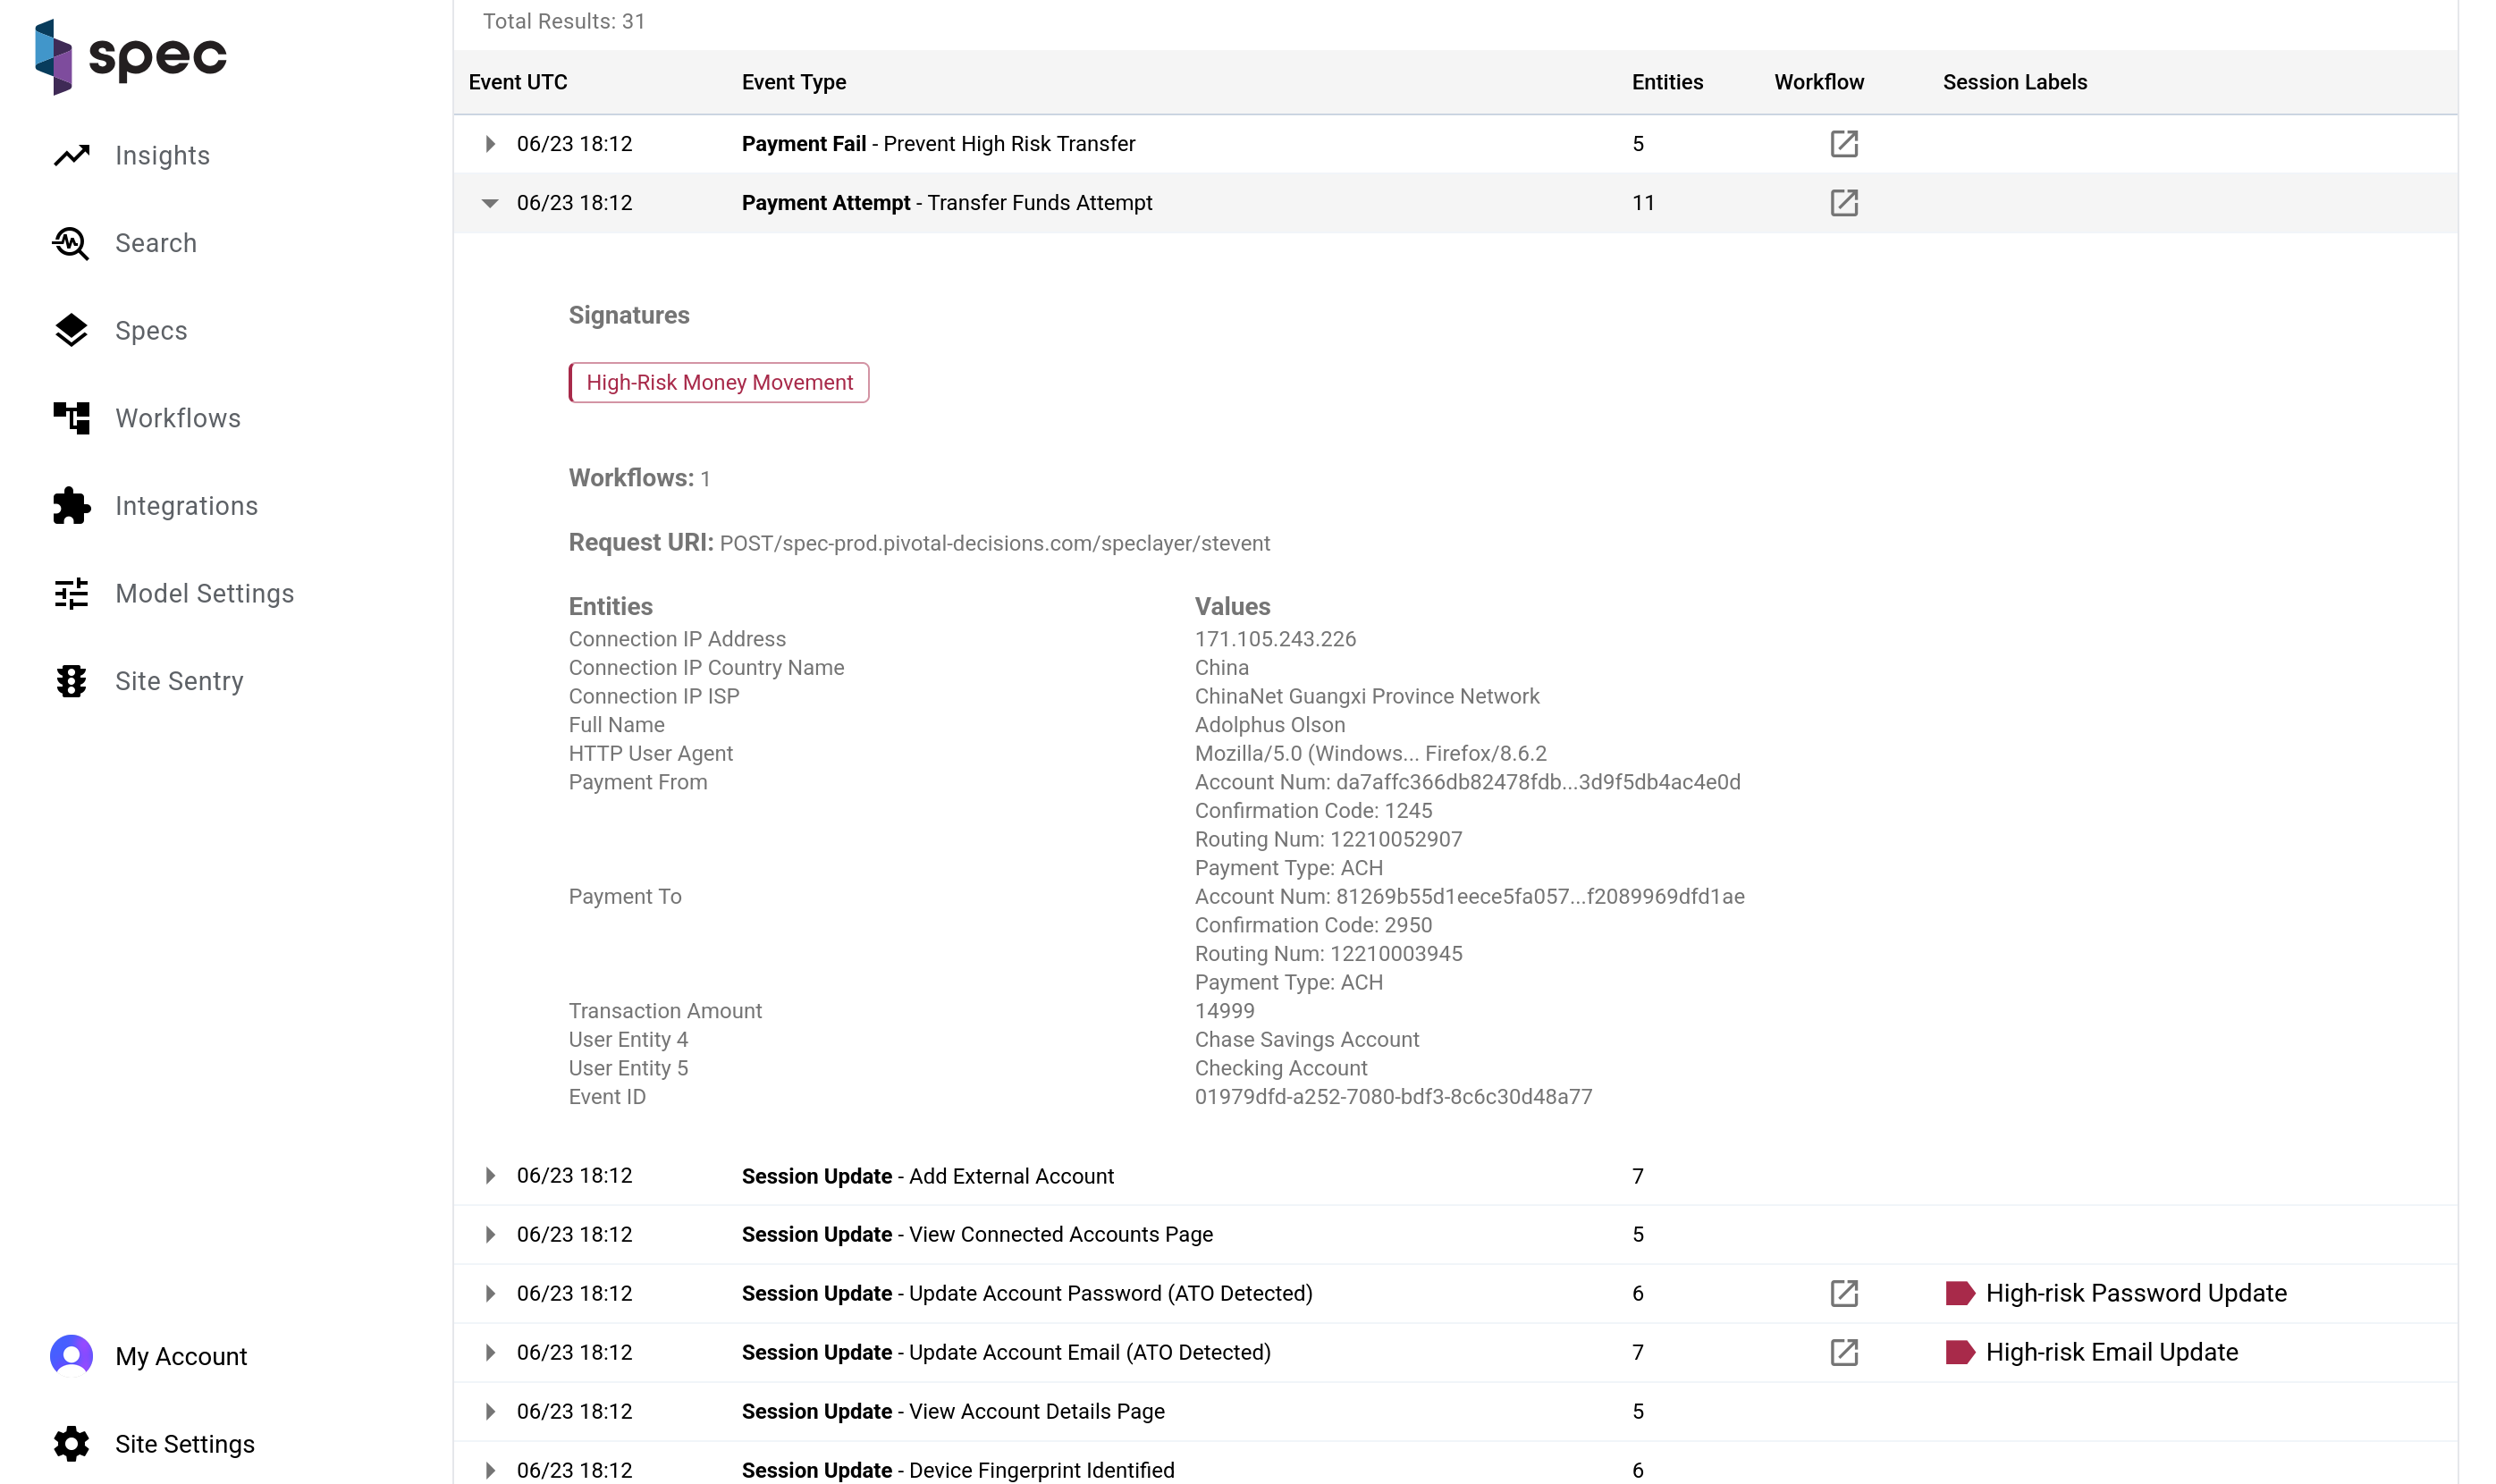
Event Timeline by Risk Rating Chart
This chart is a visualization of the user journey and a litmus test for the riskiness of a session. A session can be categorized under 3 levels of risk: normal (green), suspicious (yellow), and malicious (red). The banner on the right side of the chart tells you this is a malicious session.
The size of each bubble on the chart indicates the volume of events that took place during that bucket of time, and each bubble is given a color based on the session risk rating, which can change over time. You can see in the timeline of the chart exactly where the session turns from a normal session to a malicious session. If you hover over the bubbles on the chart, you can see what events took place at the time indicated by the x-axis. In the video above, you can see that the customer made multiple attempts at a payment, which ultimately resulted in payment failures.
Actions, Signatures, and Session Labels
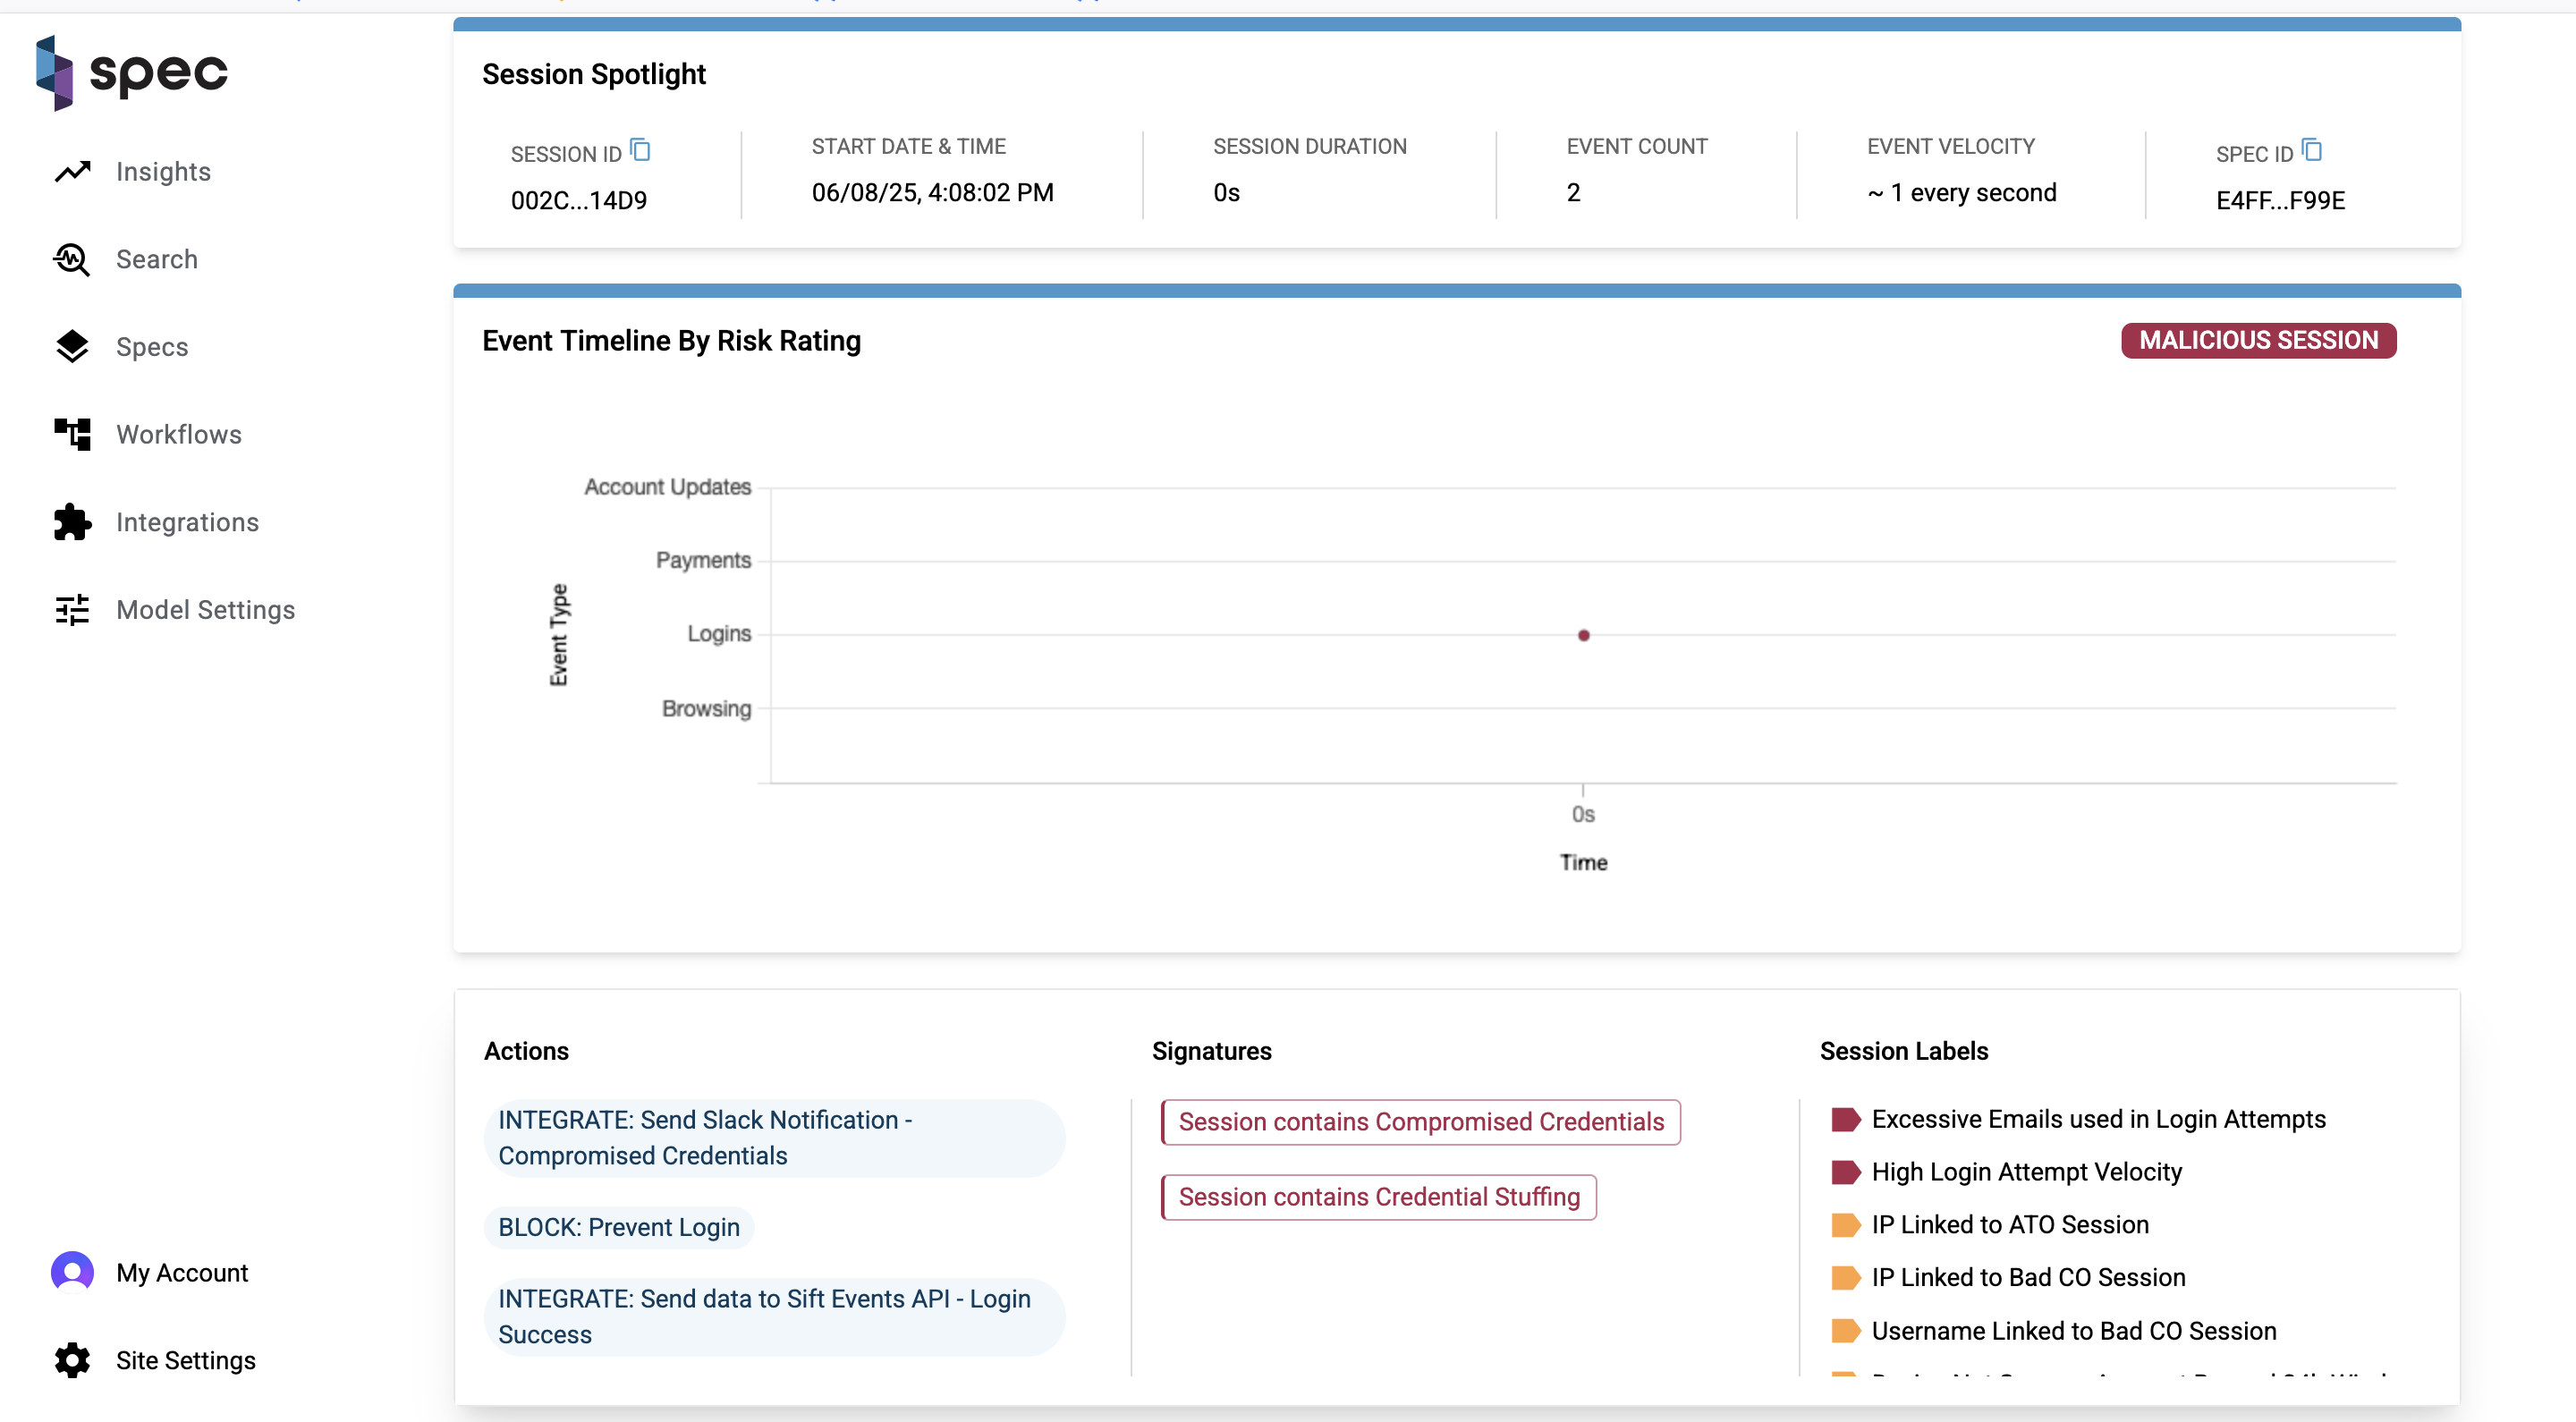
Session labels, signatures, and actions together describe the signals, patterns of behavior, and responses taken by the Spec platform for a given session. A collection of session labels can trigger the placement of a signature label, and actions are Spec's response to any of this activity.
You can actually see in the Event Timeline chart where an action was taken and a session ended. Here is a "honeypotting" example, in which a bad actor logs in and attempts to make a fraudulent refund request. Spec then takes action in response, displaying a fake honeypot so that the user thinks their fraudulent request was successful. With the user thinking they've accomplished their goal, the session ends.
The visuals of the Event Timeline by Risk Rating chart and the information on the Actions, Signatures, and Session Labels card show you how powerful the Spec engine is in stopping fraud in realtime and bringing that play-by-play to our customers.

Event Timeline Table
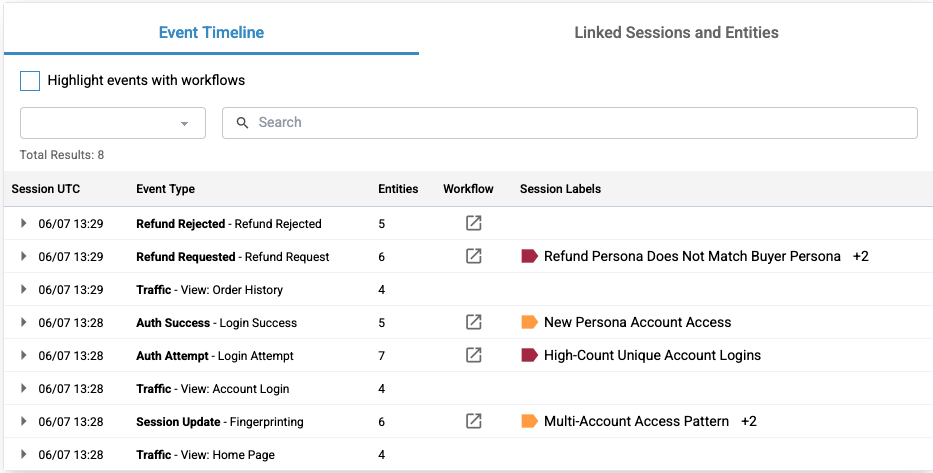
The Event Timeline table is an event-by-event breakdown of the session. Every piece of activity a user triggers on their session journey is laid out from start to finish on this table. The columns are listed as follows:
- Event UTC: The date and time the event took place in descending order.
- Event Type: Each event has an associated type. This column displays the type of the event and it's name.
- Entities: A count of the entities involved with the event.
- Workflow: If a workflow icon is present, a workflow was run on this event.
- Session Labels: If session labels are present, one or more labels were set on this event.
Each row on the table expands to show more information about the event.
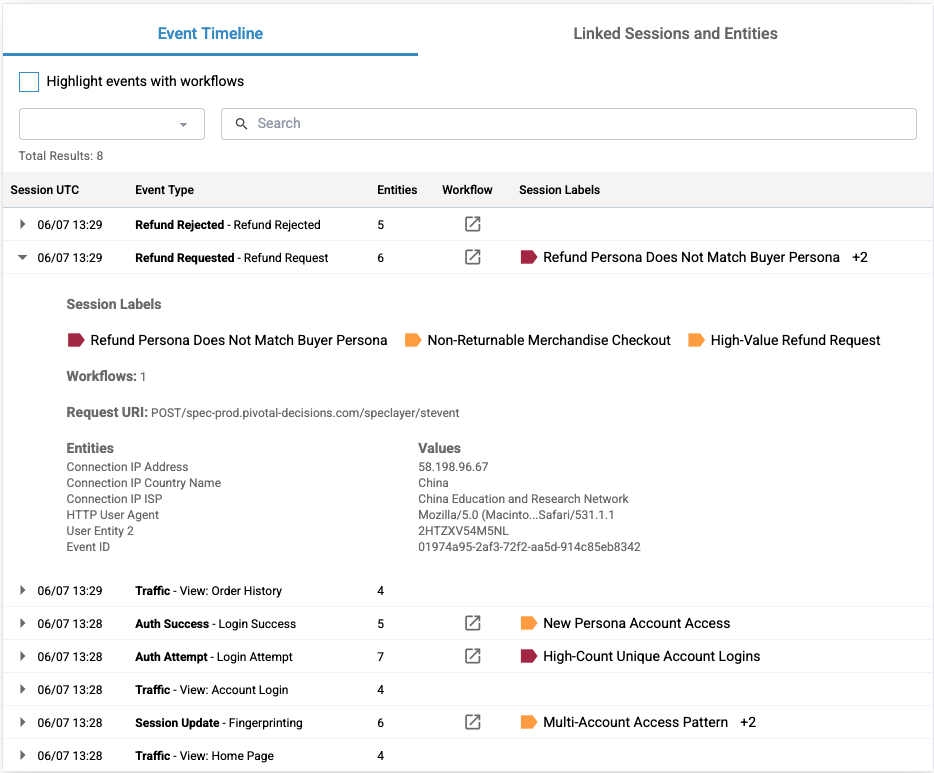
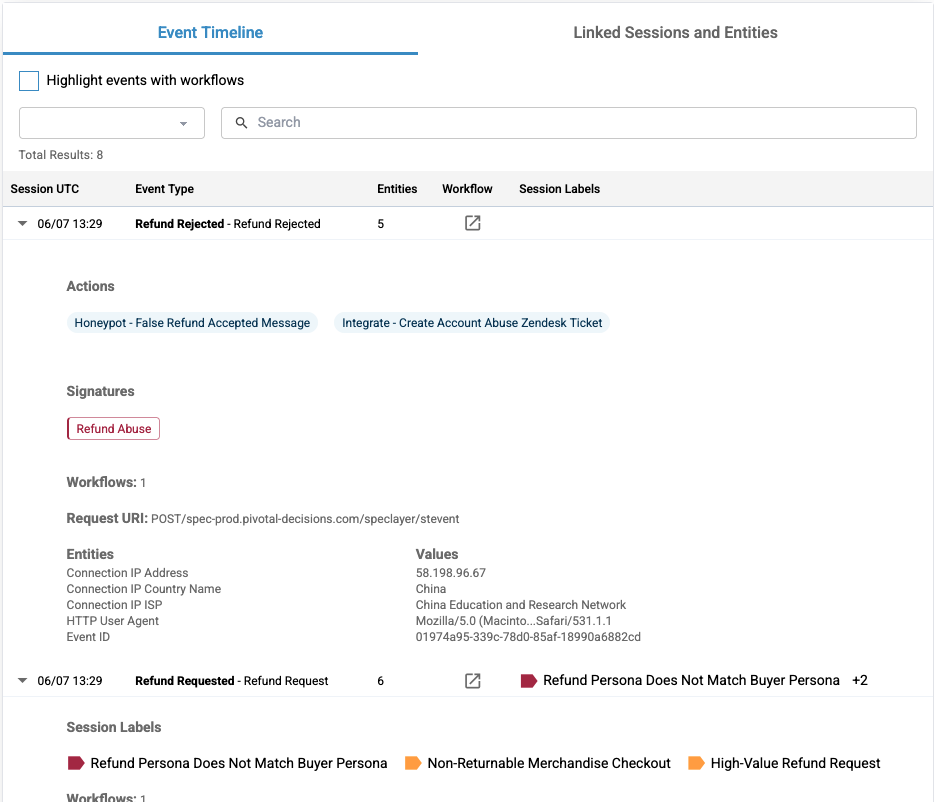
At the top of the expanded section is a list of the labels that were placed on the event. In the honeypotting example, the labels "Refund Persona Does Not Match Buyer Persona", "Non-Returnable Merchandise Checkout", and "High-Value Refund Request" were placed on the "Refund Requested" event. One workflow ran on this request. You can also see the entities that were involved as well.
In the last event that took place on the session, you can see that the signature "Refund Abuse" and the honeypotting action was taken.
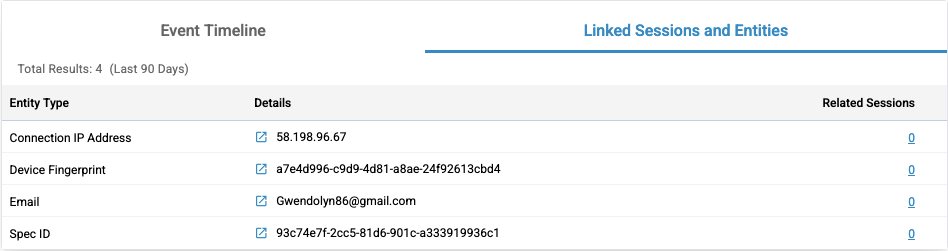
Linked Sessions and Entities
Finally, the Linked Sessions and Entities table displays a list of important entities involved in the session. Here are the columns for this table:
- Entity Type: Every entity has an associated type (example: "email").
- Entity Detail: The entity value (example: "sample@email.com").
- Related Sessions: Count of all the sessions the entity appears in.
Click the icon to the left of the entity detail to navigate to the Entity Linking and Behavior page, which allows you to investigate that entity further. See the document Entity Behavior & Linking page for more information on this. Click on the number under the Related Sessions column for an entity to explore all of the sessions in which the entity has been.
Entity Behavior & Linking Page
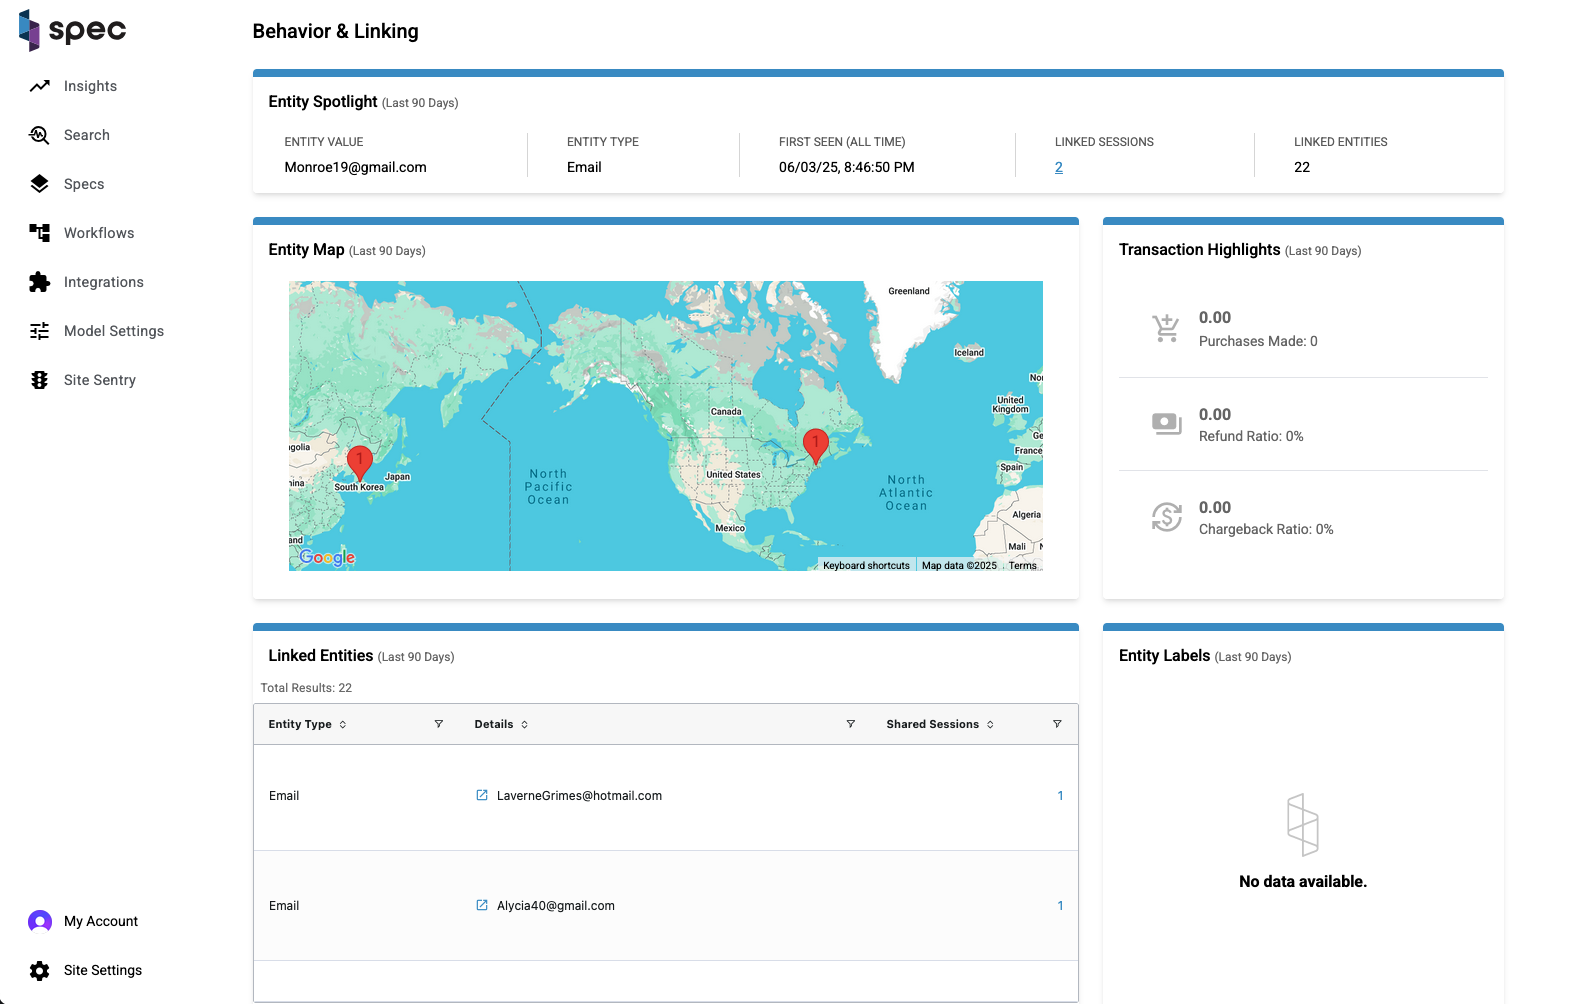
High Level Overview
The Entity Linking and Behavior page, EB&L, allows a user to dig into an event or a session and investigate any information that has been associated with the entity within the last 90 days.
Entity Spotlight
The "spotlight" or summary of the investigated entity exposes 5 important pieces of information for the reader.
- Entity Value: Value or name of the entity.
- Entity Type: Every entity has an associated type. This could be a name, phone number, connection IP Address or any other information that can be associated with a good or bad customer. Supported entities on this page include:
- Account Address
- Billing Address
- Customer ID
- Merchant ID
- Order ID
- Refund ID
- Tracking ID
- Shipping Address
- Device Fingerprint
- Billing Email
- EIN
- Email To
- IP Address
- IP DNS Address
- IP Hidden Address
- Payment From
- Payment From Account ID
- Payment To
- Payment To Account ID
- Phone
- Alt Phone
- Billing Phone
- Shipping Phone
- SSN
- Username
- First Seen: First time the entity was ever seen. This is the only portion of the page that is not limited to the last 90 days.
- Linked Sessions: All the sessions that this entity has been linked to within the last 90 days.
- Linked Entities: All the entities that this entity has been linked to within the last 90 days.
Entity Map
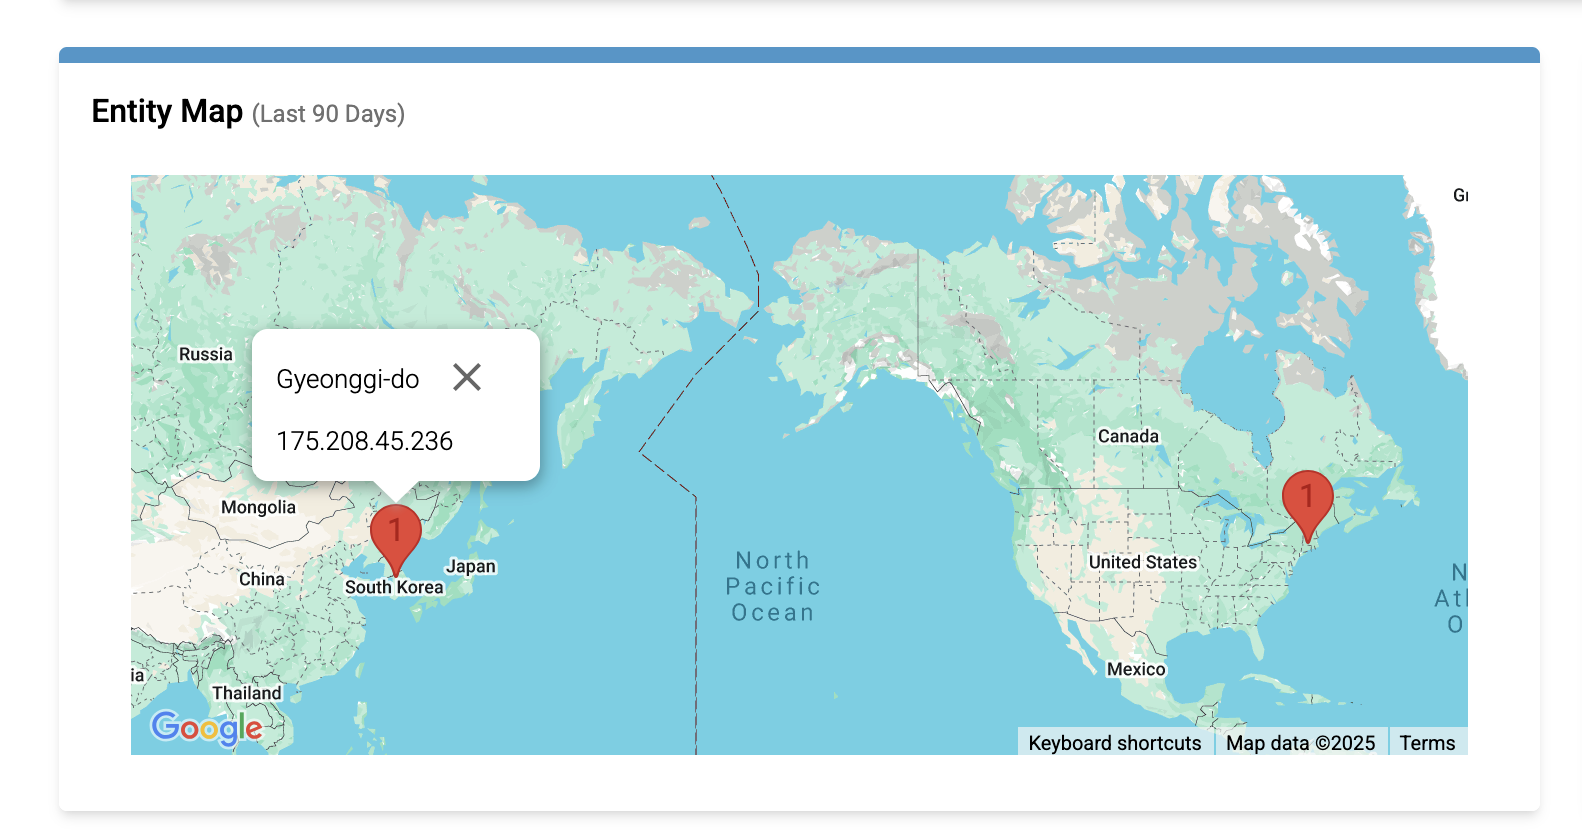
The map displays the geographic regions where the entity has been seen. You can click on a location pin to display a list of IP addresses from that region, which is helpful in addressing entities involved in IP cycling attacks.
In the example above, the entity's IP links to the regions Gyeonggi-do, South Korea and Massachusetts, United States.
Transaction Highlights
Spec highlights transaction metrics for particular entities. This information derives from an element that we store called transaction amount. There are three metrics here:
- Dollars and count of purchases made by a linked entity.
- Dollars of refunds requested and a ratio of the count of refunds requested to count of overall purchases.
- Dollars of chargebacks and a ratio of the count of chargebacks requested and count of overall purchases.
Clicking on "View" will direct you to the Search tab with any sessions involved with the transaction.
Linked Entities
The Linked Entities table displays all the entities that the current entity has been seen with in any session within the last 90 days. As you can see, the total results of this table matches what is displayed in the Entity Spotlight under "Linked Entities".
From this table, you can click on the "Shared Sessions" that the current entity and the entity on the table row have been seen together in. You can also click on the link to the left of an entity's detail to open a new EB&L page for the entity displayed on the table row clicked. This can be a very powerful tool to investigate malicious entities and everyone and everything connected to them.
Entity Labels
An Entity Label is configurable text that can be applied to any entity to classify and identify it. Typically, these labels are applied to entities that link to confirmed bad activity. Two specific examples are "entity seen in bad session" and "entity linked to bad session".
Conclusion
As an investigation tool, this page is very powerful because it highlights and exposes information about an entity that allows you to quickly determine whether an entity is good or bad. You can then take further action from this page to decipher whether other linked entities and sessions are good or bad.
Realtime Engine
Introduction
The Realtime Engine (RE) is a network platform that sits between end users and customer origin servers. RE reads the network messages and extracts data from them, enabling realtime inspection, modification, and risk assessments on both requests and responses. The architecture of the Spec Platform allows it to remain undetected and it does not require any client side JavaScript or SDKs to operate. The platform is highly configurable and provides out-of-the-box functionality to solve most business use cases with the additional capability of fine tuning for custom applications.
Specs
Specs are the primary configuration of the Realtime Engine. These configurations determine how the engine will match network requests and extract data. When a Spec matches a network request, an Event is created. This is also where Workflows are attached to Events, which may execute an Action to modify the network message. Much of this configuration is available through the Spec Hub.
Integrations
The Realtime Engine can communicate with any services over HTTPS. If you can communicate over a REST API or a web server, then the Spec Platform can interact with that service. This capability is used by customers to integrate with their systems by opening tickets when a fraud incident requires human intervention or to alert through relevant channels when risky behavior has been observed on their application. Monitoring is not the only use for integrations; the RE can connect to data services on behalf of the customer to include additional metadata in any Event the platform creates.
Networking
The RE sits between the web browser and the customer origin. In most cases, customers utilize Content Delivery Networks (CDNs) to deliver their content across the globe. These CDNs offer many deployment methods for the Spec Platform, which integrates immediately after the CDN. Read the integration documentation for more details on the deployment methods.
Sessions
Sessions are a series of collated Events. Our proprietary algorithm joins these Events using a variety of metrics and behavioral patterns. These Sessions represent a contiguous block of interaction with the customer application. Sessions are related across time by their Spec ID.
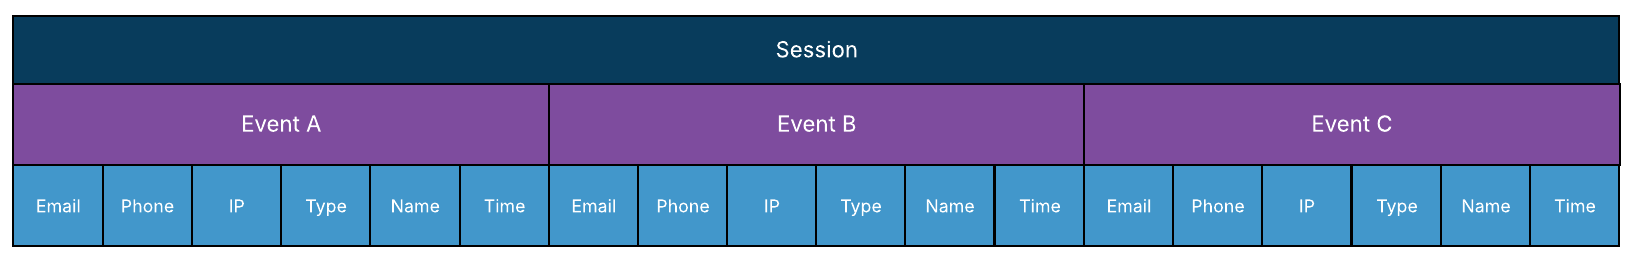
Sessions, the top row, contain Events!
Data
Sessions contain metadata about behaviors observed during interaction with the customer application. The rules engine, which determines the risk rating of the Session, also contributes to the Session metadata. Each Session has an individual ID, and related Sessions are also joined by a unique Spec ID. Spec ID collates Sessions that occur over time.
Sessions are composed of an ordered sequence of Events. These Events contain Elements that describe the data points observed within a single Event. Each Event will have an ID, several mapped entities, and any Session Labels that were applied as a result of the rules engine. Session Labels can be observed by any Event occurring after they are applied. These labels can be informational, can identify risky behaviors, and can correlate behaviors into Signatures.
Spec ID
The Spec ID for a Session will unite this Session with other Sessions across time. In the introduction, we mentioned that Sessions represent a contiguous block of interaction with the customer application. Spec ID joins these blocks together into a series and allows us to identify users over time.
An example can help interpret exactly what we mean by this. Imagine we have User A who visits an application to buy shoes. The user logs in on day 1, searches for the shoes they would like to purchase, and then buys that pair of shoes. This is a contiguous block of interaction: the user came to the application, navigated through it, and purchased something. Five days later, this user returns and attempts to return these shoes, and this is recorded in the Spec Platform as a new Session.
important
Spec ID is responsible for recognizing that these two disjoint interactions with the customer application are performed by a single user!
Risk Rating
The Session Risk Rating is an assessment of the trustworthiness of the Session. Sessions can have ratings of Normal, Suspicious, or Malicious. A Session's risk rating is assessed and continuously reassessed with every new event that is recorded during the Session. The models that produce the Risk Rating are tuned over time as new behavioral patterns emerge in the application landscape.
Many behaviors and metrics can contribute to a Risk Rating for a given Session. As the Session accumulates more Events over time, the Risk Rating may change. If a Session reaches a malicious Risk Rating, and Spec is in Active mode, Spec will instantly mitigate the risk, using your preferred mitigation method.
Analysis and Querying
Session Search provides investigators with the ability to search through all Sessions collected. Investigators can drill down further into Sessions through the User Session Assessment page to find patterns and links between malicious actors. When Sessions share an entity they are considered linked, and these connections help identify malicious behavior across Sessions.
Insights provide visualizations that describe the behavior of Sessions in the customer application. These graphs provide quick feedback about the application landscape and offer further investigation on Sessions that occur.
Events
Introduction
Events are the individual interactions a user has with your website. Each event represents a discrete action or request — such as a login attempt, a transaction, or a page view — captured as it happens in real time. Events are the building blocks of Sessions, and together they provide the raw data for behavioral analysis, risk assessment, and investigation. The Hub’s architecture is designed to capture, enrich, and analyze these events to surface meaningful insights and automate security and fraud responses.
Events, the middle row, contain Elements!
Data
Events are structured collections of Elements. When an Event is created, it may trigger a Workflow. Workflows are a set of automated rules and actions that operate on the Event, its data, and its associated Session.
Events contain many important data features; these are covered in detail in the Elements documentation. There are a handful worth mentioning in the context of Events. All Events have an ID and a timestamp to identify them and when they were observed. Events have a human readable name and a type, which takes a finite set of values and serves as a way to congregate Events that are similar in their structure. Each Event has an associated Session ID to link it to its parent Session as well as any Session Labels that were placed on the Session as a result of this Event. Let's look at an example of this data:
| Session ID | Event ID | Timestamp | Event Name | Event Type | Session Labels | More Data... | |
|---|---|---|---|---|---|---|---|
| 1 | 1 | 2025-01-01 06:00:00 | Login through API | Authentication Attempt | [] | test@testing.com | ... |
| 2 | 1 | 2025-01-02 16:00:00 | Login through Form | Authentication Attempt | [] | another@testing.com | ... |
| 2 | 2 | 2025-01-02 16:11:00 | View Product | Session Update | ["Returning User"] | another@testing.com | ... |
| 2 | 3 | 2025-01-02 16:15:00 | Buy Product | Transaction | ["Average Purchase Behavior"] | another@testing.com | ... |
This table shows two Sessions, each with their own Events. The Elements that identify the Event itself are present: Event ID, Session ID, Timestamp, Event Name, and Event Type. Following these are an example of some more data elements, there are over 200 possible Elements that can be mapped from applications. Typically, only a subset of these elements are mapped as they relate to business use cases. "Email" and "More Data" signify the collection of these further Elements.
Risk Rating
The Sessions article talks about the Session Risk Rating, but we need to cover an important detail as it relates to Events. The Session Risk Rating on an Event is the Risk Rating as it was recorded at the time of the Event. We do not go back in time to update the Risk Rating on Events if the rating changes later in the Session.
note
This enables investigators to observe how the risk rating changes over time and exactly which Event changes the risk rating and why.
The User Session Assessment's Risk Rating Chart is a visual representation of how the Session's Risk Rating evolves over time as more Events are observed. The individual Events are responsible for changing the Risk Rating and those changes are carried forward to future Events through the Session.
Session Labels
We mention that Session Labels are set on an Event, but they apply to the entire Session. What we mean by this is that an individual label is placed when an Event occurs. These labels are accessible to any subsequent Event when the rules engine queries for any labels stored on the Session. When observing an Event in the Hub, you will see the Session Labels that were placed on that Event, and only those Session Labels. The Session view on the User Session Assessment will show all Session Labels that were applied during the Session.
Actions
Actions occur on an Event when the Realtime Engine does something about the Event. These actions may notify a customer that risky behavior is potentially occurring (and the data associated with the behavior), modify the request to inform customer applications of the behavior, or stop the behavior altogether! Actions are taken on individual Events, but the data from the overall Session is used to determine whether we should take this Action.
Analysis and Querying
The Hub provides powerful tools for analyzing events. The User Session Assessment has an Event Timeline that details the series of Events within the Session in chronological order. The timeline can be filtered by event type, event name, and session labels, making it easy to focus on relevant activity.
For deeper investigation, the Event Inspector allows users to drill down into the finest details of any individual event. Analysts can view all elements, labels, rule executions, and actions taken associated with the event. This granular view allows users to inspect what happened on a given Event and why.
Elements
Introduction
Elements are the core data fields that make up every Event in the Spec Hub. They represent the individual pieces of information — such as an email address, device fingerprint, or transaction amount — that are captured, normalized, and analyzed throughout the Spec Platform. Elements provide semantic meaning behind raw data, enabling powerful linking, aggregation, and behavioral analysis across Sessions and Events.
Elements, the final row, are the building blocks of Events and Sessions!
Data
There are two primary types of elements: Entities and Attributes. Elements are a named and normalized collection of data. The Spec Platform creates a clean and comprehensive dataset from the beginning.
Entities
These are linking data, such as user IDs, device fingerprints, or account numbers. Entities are used to connect events and sessions, enabling aggregation, co-occurrence analysis, and behavioral linking across the Hub.
The Event Timeline shows primary elements for each Event. These are frequently used Elements that many business applications have in common. The Event Inspector will show all Elements that were recorded on the Event including custom data Elements.
Attributes
These are descriptive data, such as browser type, transaction value, or geolocation (latitude and longitude). Attributes provide context for analysis but do not drive linking between Events or Sessions.
Analysis
The Event Timeline shows many of the Elements at the forefront of investigation. To view all of values on an Event, including all attributes and custom elements, click the popout link in the Event Timeline to navigate to the Event Inspector.
Types
Each element has both a complex value type and a simple value type.
Complex value types include structured data like addresses, payment accounts, and email addresses. For example, an address element is stored as a collection of street, city, region, postal code, and country. Without enough information to build the address, the complex element will be empty. You can see the component elements in the Event Inspector to investigate why the address was incomplete. Email addresses are a single element, but their value is validated as a proper email address and normalized.
Here are a set of examples showing the element type labeling and categorizations that the platform performs behind the scenes.
| Type | Description |
|---|---|
| Session Risk Rating | Normal, Suspicious, or Malicious |
| Address | Structured object with fields like street, city, region, postal_code, country, latitude, longitude |
Must look like a valid email address, me@specprotected.com | |
| Phone Number | Digits only, with formatting characters stripped |
| Payment Type | Type of payment (e.g., "credit_card", "checking") |
| Country | Valid country name or abbreviation |
| Currency | Valid currency abbreviation (e.g., "USD") |
| IP Address | Valid IP address string |
| Month | Number from 1 - 12 |
| Year | Number from 1 - 12 |
note
Please note that the table above is not meant to be an exhaustive list as the details behind these value types is contained within the Spec Platform.
Simple value types are strings, numbers, and booleans. These are used for straightforward data like names, money amounts, or flags. Complex types contain values with simple types, but give these simple types more context. For example, country codes are compared case-insensitively and as two-character codes, despite all country codes being a simple string type and the fact that country codes can be read from network data in a variety of formats. The end result is a conversion to a standard, cleaned, and normalized data element.
Elements in the Hub
The Hub supports over 200 elements, each with a specific value type and normalization logic. As data is ingested, element values are normalized according to their type, ensuring that all data is cleaned and standardized in the data warehouse prior to storage.
Elements are labeled with human-readable names for clarity in the UI, such as “Email,” “Shipping Address,” or “Payment To Account Number.” Sensitive elements, like payment account numbers, are hashed to comply with PCI requirements and other data protection standards. Elements are the foundational pieces of Events as they are the data points that are recorded when the Event is observed.
Mitigation
Overview
When deployed inline, Spec can take action to nullify attacks before they ever reach your systems. We provide a variety of standard mitigation strategies, but we are also always happy to work with customers to explore novel approaches to deal with the specific attacks that they are seeing.
Unlike other vendors, Spec is able to take action based on the totality of your traffic, tying together disparate events into unified sessions, and linking sessions by common entities. This visibility allows Spec to better spot malicious behavior from bots, fraudsters, and malicious users.
Here, we discuss some of the ways that Spec can mitigate incoming attacks. As mentioned above, this is not a comprehensive list: Spec engineers are constantly evolving the platform to address new threats, and we are more than happy to work with our customers to develop new strategies for their use cases.
Mitigation Process
Broadly, the decision to take mitigating action is driven by the presence of Signatures. As we process incoming events, we group events from the same user into a Session. Similarly, disparate Sessions are grouped by the presence of common entities.
When certain behavioral patterns are detected in a Session or among entities in a Session, Spec applies Labels tagging that behavior. While an individual Label may not necessarily indicate malicious behavior, a collection of such Labels can lead to the application of a Signature, a sort of meta-label that indicates a broader pattern of behavior.
The presence of a Signature can also trigger the application of an Action. There are a variety of Actions that we may apply, including the mitigating actions discussed in this document. In addition to mitigation, Actions may include notifying your team in your medium of choice (Slack, Jira, etc.), triggering some downstream service, etc.
This entire process is deterministic, explainable, and can be introspected in the Spec Hub, where you can see all of the Labels, Signatures, and Actions that were taken in a given Session.
Mitigation Availability
As noted elsewhere, Spec can be deployed in a variety of configurations. Full mitigation is only available in Active Mode, via either a DNS Integration or a CDN Integration configured to use inline mode. A limited subset of mitigation Actions are available in Pass-through or Mirror mode.
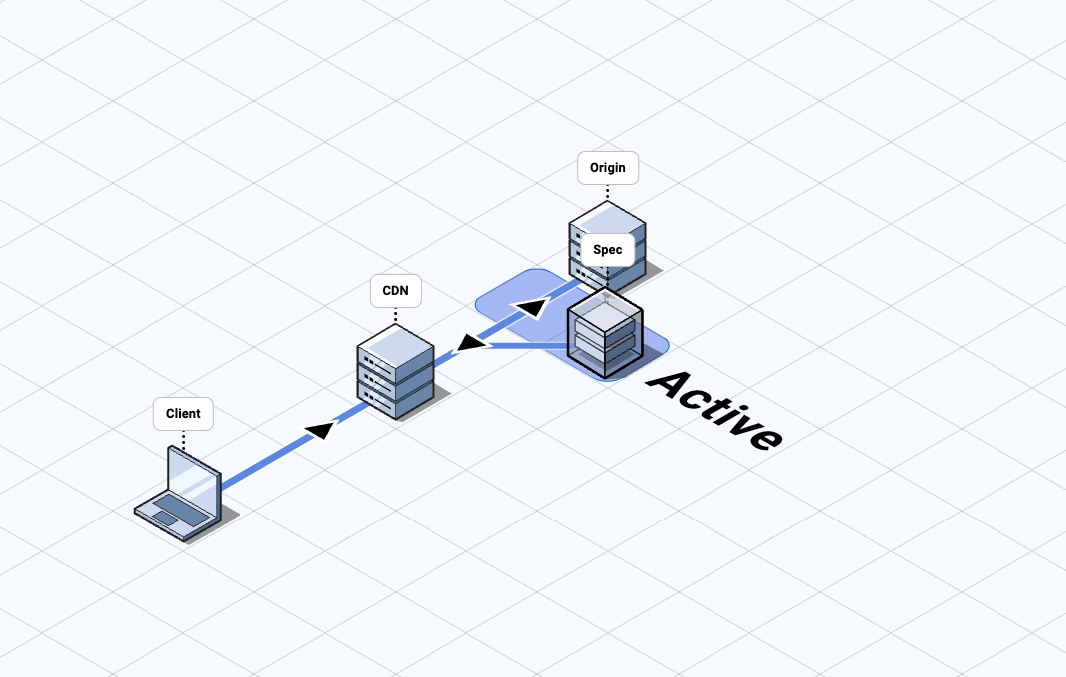
Active Mode
In Active Mode, Spec sees both request and response traffic, and is able to take action either on a request, before it reaches your servers, or on a response, before it reaches the user. Actions are based on blazingly fast realtime analysis and can respond to changes in incoming traffic patterns based on intelligent risk assessment.
Pass-through/Mirror Mode
Mitigating actions are more limited in these modes. Spec is only able to perform traffic analysis and risk assessment, with actions limited to asynchronous operations like sending Slack alerts, populating charts and reports, etc. The assessments provided in these modes can be illuminating: we regularly have customers initially deploy in Pass-through Mode, only to upgrade to Active Mode when they see how many attacks we could be stopping for them.
Example Mitigations
The following are some typical Mitigations that Spec can deploy in order to address fraudulent or bot traffic. This is not a comprehensive list: there is a wide variety of mitigating Actions we can take, and we are always happy to work with our customers to find the best fit for their use cases.
Honeypot
One popular and historically effective Mitigation is the Honeypot. In this pattern, when Spec detects suspicious traffic, we redirect it to a decoy endpoint, where we then allow the attacker to harmlessly submit data for further analysis.
As an example, consider an account takeover (ATO) attack, in which a malicious user is rolling through a script trying out thousands of usernames and passwords, perhaps scraped from some public breach of another website. When the realtime platform detects ATO behavior from a session, it can intercept the login requests and send them to an alternative backend endpoint, which is totally invisible to the attacker, while simultaneously returning an "Unauthorized" response to the attacker. This allows our customers to collect submitted credentials and notify their users that their accounts have been compromised, while making the attacker think that all their purchased credentials are invalid.
The Honeypot pattern can be used in a variety of ways, allowing for attacker identification, attack pattern recognition, and threat intelligence gathering. It is one of the most powerful tools in the Spec toolbox.
Step-up Challenges
Another common Mitigation is the Step-up Challenge. No, this is not a segment of a jazzercise class, but rather a heightening of security based on the presence of suspicious Session behavior.
For example, based on the presence of suspicious behavior, Spec can direct a login to an additional challenge, such as requiring a 2FA code, redirecting to an interstitial page requiring JavaScript proof-of-work to catch bots, or triggering a captcha. Since Sessions are evaluated on a sliding scale of risk level, we can tailor the challenge to the risk.
Of course, we can also invert these patterns to optimize the experience for known good sessions. A login by a trusted user in an expected Session context can be treated as safe, bypassing any increased security checks and smoothing out their experience.
Key Advantages
The Spec platform provides a number of major advantages over other solutions on the market. We provide transparent, inline protection: attackers don't even know we're there, but we still sit in front of your servers, providing a shield against malicious traffic.
Transparency
- No JavaScript integration: deployment of the Spec platform requires zero changes to the content of your site
- Invisible to attackers: from the outside, your traffic still looks like it's flowing straight to you
- No client-side detection: because there is no Spec-specific JS added to your site and no outbound requests to Spec, client-side attackers can't tell they're being watched
Protection
- They're attacking us, not you: inbound attacks hit us first, giving us the opportunity to mitigate before the malicious traffic ever reaches your servers
- Centralized defense: Spec provides a centralized point of defense for all inbound traffic, which lets us build a comprehensive profile of Session behavior across time
- Shared threat intelligence: we are constantly seeing new attacks across all of our customers, and we are able to bring learnings from those attacks to your environment, providing proactive protection.
Processing Modes
The Spec Platform can run in three processing modes:
Pass-through
- All traffic streams unbuffered through a Spec region. Spec copies data and
generates events based on requests and responses.
- Traversing a Spec region in pass-through has a <1 ms p95 latency.

Active
- Most traffic (usually > 99%) streams unbuffered through the Spec network. Spec
copies data and generates events based on requests and responses.
- Traversing a Spec region in active mode has a <1 ms p95 latency.
- Specific routes where Spec may take realtime enforcement action will be
processed synchronously. The most common usage includes requests that
represent authorization attempts, payment attempts, or account updates. These
usually account for less than < 1% of all traffic.
- Synchronous processing has a <20ms p95 latency on these targeted requests, but customers can configure workflows that trigger synchronous integrations that would add their round trip time to this processing.
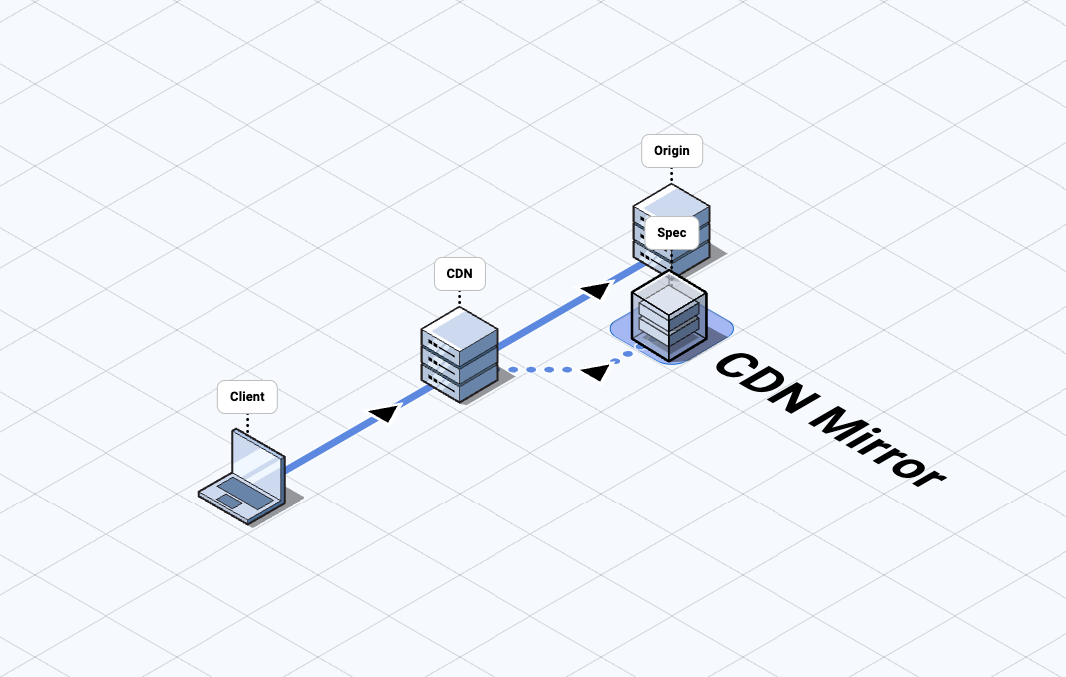
CDN Mirror
- The customer configures an external mirror to forward requests to a Spec
region, where the mirrored requests are terminated.
- Sending requests to Spec this way is typically done at the CDN and is subject to the performance and limitations of that CDN's request mirroring capability.
Comparison of Processing Modes
The table below outlines the capabilities, considerations, and deployment tasks associated with each processing mode:
| Pass-through | Active | CDN Mirror | |
|---|---|---|---|
| Events Available |
|
|
|
| Actions Available |
|
|
|
| Network Updates |
|
|
|
| Availability Features |
|
|
|
| Connection Methods |
|
|
|
Note:
- Some platforms impose Service Worker implementations that may not be appropriate for your application.
Regional Deployments
Spec utilizes regional processing near customer origins to eliminate unnecessary latency.
Spec regions allow bidirectional traffic scanning along the normal network routing used to send requests to the origin and optimize connection handling to achieve the lowest possible network round-trip time.
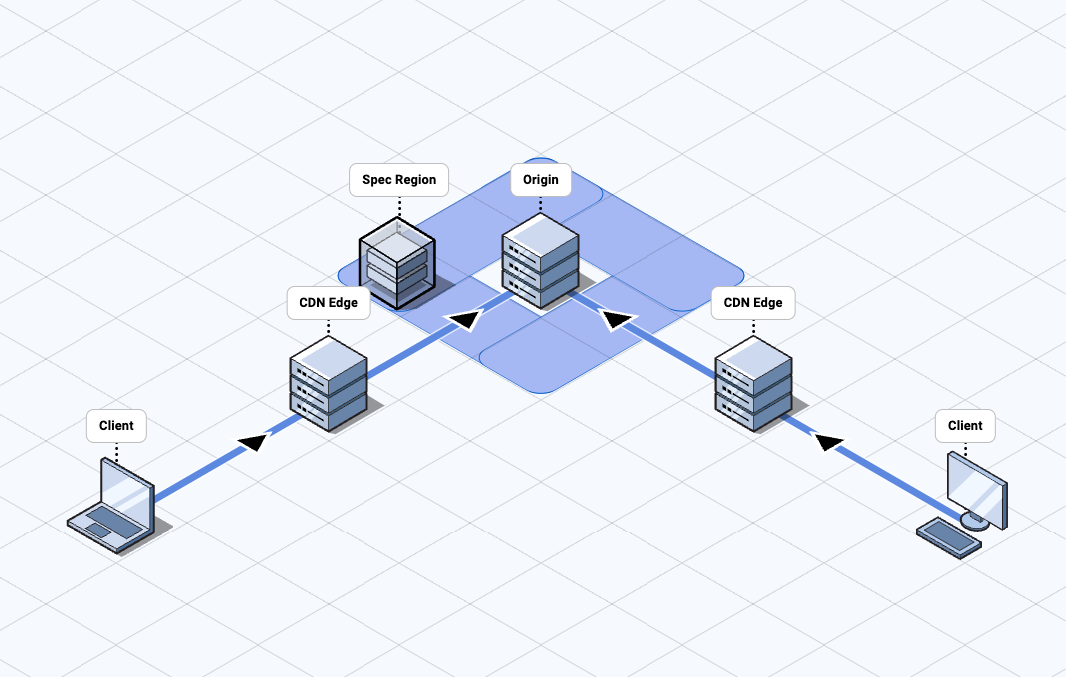
This is also important for Spec failover and redundancy features, as traffic follows the same predictable network routes regardless of whether Spec is actively processing traffic or removed from the traffic flow.
Getting Started
Spec integrates seamlessly with your platform through multiple methods including service worker from the edge network and DNS. All integration methods allow the Realtime Engine to reside in the path of web traffic between your end users and your protected origins.
Spec receives network traffic, analyzes it in real time, and responds to origin-bound traffic to identify and mitigate abnormal behavior.
important
The Realtime Engine strictly enforces HTTPS. Any insecure HTTP calls are rejected with a 502 (Bad Gateway) response. Upstream service providers must be explicitly configured to exclusively use HTTPS for all traffic.
note
The listed integration methods are the most commonly used. If your preferred integration method is not listed in these documents, please ask your Product Success representative.
Integration Guides
Service Workers
Supported Providers
Spec maintains a collection of NPM-hosted integration libraries to ensure seamless delivery of traffic from your preferred cloud provider to the Realtime Engine.
note
If Spec doesn't support a provider you need, contact your Product Success representative.
Configuration
Service Workers enable seamless integration with Spec at the CDN level. Our easy-to-use libraries handle everything in the background. The integration requires a single function call, with flexible configuration options for routing traffic to the Spec Platform.
The following are the configuration options that are common to all service workers:
| Key | Type | Default | Notes |
|---|---|---|---|
| disableSpecProxy | Boolean | false | Enable or disable realtime processing. When disabled (true), all traffic bypasses Realtime Engine and goes directly to origin servers, ignoring all other settings. |
| inlineMode | Boolean | false | Switch between two realtime processing modes:Active Inline (true) routes traffic through the Spec Trust Cloud for inline mitigations.Mirror Mode (false) duplicates traffic for Spec processing while sending the original directly to the customer's origin, without inline mitigations. |
| percentageOfIPs | Number | 100 | The percentage of IP addresses to route through the Realtime Engine; the rest go directly to the customer's origin. Useful for gradual onboarding or rollout. |
| customerKey | String | none | A key from Spec to verify that traffic originates from a customer-controlled service worker. |
| domainOverride | String | none | Forces a specific Spec worker hostname, overriding the dynamic hostname creation. Useful when coordinating multiple hostnames to a single origin, when using destination routing, or when SSL/TLS certificates are handled upstream from Spec. |
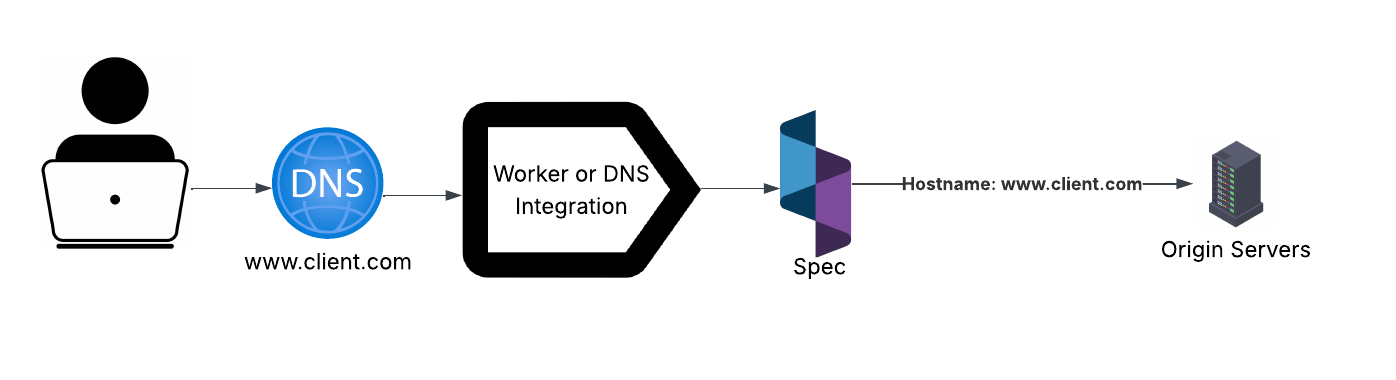
Service Worker Networking
Each of the supported provider-specific NPM packages wraps our core generic library:
The inlineMode configuration value determines which of the service worker's
two primary networking behaviors is used: Mirror or Inline (which
includes Active Inline and Pass Through modes). To route traffic to the
Realtime Engine, the service worker appends a Spec-managed domain to the incoming
host value, for example:
www.client.com.spec-domain.com
note
The appended hostname will be provided upon integration, and is useful in validating the Spec health check endpoint:
www.client.com.spec-domain.com/example/healthz
important
The domainOverride config value disables dynamic hostname creation and forces all requests
to use a single Spec hostname. This alters Realtime Engine behavior and should be configured
in coordination with the Spec integration team.
Mirror Mode
inlineModeis set tofalse
In mirror mode, the service worker receives each incoming request and constructs
a copy using a provider-specific request constructor. This copied request is
sent in the background to Spec servers, which return a 200 OK response.
Meanwhile, the original request proceeds to your origin server without delay.
The Realtime Engine only sees the request, not the response.
- Non-blocking behavior: The service worker does not wait for a response from Spec before forwarding the request.
- Resilient fallback: If Spec is unavailable, traffic to your origin continues unaffected.
- No caching: Spec responses include
Cache-Control: no-storeto avoid caching the200 OKthat is generated from the backgrounded worker request.- This ensures a mirror response is never cached by the CDN or worker.
This mode enables Spec to:
- Identify fraudulent activity
- Apply labels
- Trigger asynchronous workflows (e.g., alerting your team to events)
warning
Mirror mode does not allow Spec to block or alter traffic in real time.
Active (Inline) Mode
inlineModeis set totrue
Active mode includes both Active Inline and Pass Through realtime processing modes. In all inline modes, the original network traffic is routed to Spec servers from the edge service worker, then to your origin servers. To understand how each option functions, take a look at our processing modes page. Spec removes the appended Spec-managed domain from the request and reconstructs the request to forward to an origin server. The Realtime Engine will be able to see the request and response from your origin.
- Connection efficiency: Keep-alive settings improve performance by reusing TCP connections, minimizing the overhead of repeated connection setup.
- Intelligent fallback: If Spec servers are unreachable (via DNS health check), traffic is rerouted through a secondary Spec-managed worker that strips the appended domain and forwards requests to your origin using a mapping value.
- Custom error handling: You may opt to disable fallback routing and instead serve a custom error page or response.
Inline mode retains all the benefits of mirror, with the added ability to:
- Execute synchronous workflows
- Actively block malicious requests and prevent bad actors from reaching your origin
- View response data, analyze outcomes, and take appropriate actions based on results.
Check out the page for Inline Networking for more information on our flexible routing options.
important
We recommend starting in Mirror mode during initial integration. This allows Spec to gather behavioral data, identify trends, and verify signal quality before transitioning to Active Inline mode for realtime enforcement.
Why Service Workers?
Service workers process data near users, reducing latency and enhancing realtime performance while optimizing bandwidth and improving security. Spec uses edge computing to route traffic from a CDN to Spec's Realtime Engine. It can either duplicate requests to Spec while sending the original to the origin server ("pass-through" mode) or forward requests directly to Spec, who in turn forwards requests to the origin server ("active" mode).
To learn more about the HTTP library's functionality, explore the source here:
AWS Edge@Lambda
Introduction
This guide will create two separate Edge@Lambda function bundles: one for the origin request and another for the origin response. The origin request function will package the request for processing by the Spec Platform, while the origin response function will augment the response for proper Customer Journey Security.
Prerequisites
- An existing CloudFront distribution.
- Refer to the configuration options available for the workers in configuration, also check out the known limitations below.
- Use your favorite JavaScript package installer (
yarnornpm)to install the following package into your lambda project. - An Origin Request bundle
- An Origin Response bundle
Instructions
Please note the following:
- All Edge@Lambdas must be created in the
us-east-1region in order to be associated to a CloudFront distribution. CloudFront will still replicate this function in other regions based on viewer request. - The function must not have environment variables. Everything in a replicated edge function must be self-contained.
- The function cannot be placed inside a VPC, and there is no control of egress.
Review the AWS documentation for Lambda@Edge for best practices and more information.
Add Origin Request Edge@Lambda
- Create a new Lambda function in the AWS console in the
us-east-1region. - Use the AWS managed Edge@Lambda service role.
- Upload the Origin Request bundle to the console.
- Publish a new version of the lambda bundle.
- Copy the ARN including the version.
- In the AWS CloudFront console, select the distribution to which the Lambda will be added.
- Under behaviors, find the route that should be protected by Spec.
- Paste the ARN into the
Origin Requestsection. - Check "include body" option.
- Save and wait for Edge@Lambda to propagate.
Add Origin Response Edge@Lambda
- Create a new Lambda function in the AWS console in the
us-east-1region. - Use the AWS managed Edge@Lambda service role.
- Upload the Origin Response bundle to the console.
- Publish a new version of the Lambda bundle.
- Copy the ARN including the version.
- In the CloudFront console, select the distribution to which the Lambda will be added.
- Under behaviors, find the route that should be protected by Spec.
- Paste the ARN of the
origin-response-lambdainto theOrigin Responsesection. - Check "include body" option.
- Save and wait for Edge@Lambda to propagate.
Confirm the installation
- Requests to the routes protected by the Spec Platform should behave normally.
- Any logging added to the Code Bundles should appear in the logs. See tips below.
Lambda Function Code Bundles
Spec provides the Code Bundles as public NPM packages. They are built using TypeScript and designed to work alongside other edge worker functionality.
Use your favorite JavaScript package installer (yarn or npm) to install the
following package into the project with your Lambda code.
Building an Origin Request Bundle
The following snippet is the minimum amount of code required to create the origin request Edge@Lambda bundle:
import { specProxyProcessRequest } from "@specprotected/spec-proxy-aws-edge-lambda";
import { CloudFrontRequestEvent } from "aws-lambda";

const config = {
    disableSpecProxy: false,
    inlineMode: false
}

export const handler = async (event: CloudFrontRequestEvent) => {
    return await specProxyProcessRequest(event, config);
}
Check Edge Workers page for config options
Building an Origin Response Bundle
The process for this should be very similar to the Origin Request bundle, with a slight variation on the methods we are calling to handle the response:
import { specProxyProcessResponse } from "@specprotected/spec-proxy-aws-edge-lambda";
import { CloudFrontResponseEvent } from "aws-lambda";

const config = {
    disablespecproxy: false,
    inlinemode: false
}

export const handler = async (event: CloudFrontResponseEvent) => {
    return await specProxyProcessResponse(event, config);
}
Check Edge Workers page for config options
Limitations of Edge@Lambdas
Before using this integration, please be aware of the applicable Lambda@Edge limitations set by AWS:
- The timeout for an Edge@Lambda is 5 seconds.
- If Spec and origin server combined take more than 5 seconds to respond, the Edge@Lambda will return a 502 error.
- The max memory can be 128MB.
- Our library is very compact and requires minimal processing resources. However this limit can come into play when integrating with existing functions that are heavy in business logic.
- Large responses may also trigger this memory limit.
Lambda@Edge Tips
- For more information on working with Lambdas and TypeScript:
- Since there is no debugger in Edge@Lambdas, it can be helpful to add log statements in the code for the entire event object and view the logs in CloudWatch.
- CloudWatch logs will be in the region closest to the viewer. It helps to know which region you are closest to when trying to access these logs.
- In order to deploy a new Edge@Lambda, you must first create a new version. You
can't use
$LATESTto refer to an Edge@Lambda in the CloudFront console.
Cloudflare Worker
Prerequisites
Please ensure that your development environment has the following dependencies installed with the latest version:
- Follow Cloudflare’s “Get started guide” to install Wrangler in your
development environment.
- This is the Cloudflare Workers command-line interface, which allows you to create, edit, and publish Workers projects to your Cloudflare account.
- Following installation, authenticate wrangler.
- A TypeScript or JavaScript project to install.
- The Spec Worker Library for Cloudflare.
- Check out the configuration options for the Spec Platform in #config.
- Ensure that the Always use HTTPS is enabled for your Cloudflare account.
important
Wrangler is not required. You can alternatively use the Cloudflare web UI or any other supported method to deploy your worker bundle.
The Spec Cloudflare workers only work over HTTPS. If you do not configure Always Use HTTPS in Cloudflare, requests to the worker that do not have a protocol will result in a 502.
Instructions
- Configure a new project with Wrangler, or open an existing project.
- Install NPM Spec Proxy Cloudflare
Worker
into project:
npm i –save @specprotected/spec-proxy-cloudflare-worker
- Open
index.tsfile and copy the worker code from the Prerequisites. - Publish the
worker.
Open a terminal window and run
wrangler publish
Configuring Worker Route
With the worker published, we can now use the Cloudflare admin console to configure a route that will use the Spec worker code.
- Click "Workers" from Cloudflare sidebar
- Select the newly published worker, and find the "Triggers" section.
- Click "Add Route" to add a new route for the worker.
- Enter URL that matches the traffic path you would like to send to Spec
- Select zone that pertains to the domain for your project.
- Add route.
- The Spec Cloudflare Worker is now live!
Spec Worker Library
If no existing workers exist, the following is Spec's recommended worker code. If there are existing workers, Spec's Product Success will assist in merging the following code with your existing code.
Worker Example
// Import the Spec Proxy library function
import { specProxyProcess } from "@specprotected/spec-proxy-cloudflare-worker";

// Normal Edge Worker event listener
addEventListener("fetch", (event) => {
  // If we don't catch the exception, fail open to original traffic path
  event.passThroughOnException();

  // Config object that may be hardcoded or use Cloudflare environment variables
  const config = {
    inlineMode: true,
    disableSpecProxy: false
  };

  // Spec library processes the request and returns a new, modified one back to you.
  // Please ensure that you use the returned request as the destination request
  // of your worker script. This will ensure that traffic is routed appropriately.
  let request = specProxyProcess(event, config);

  // This is the simplest form where the worker script doesn't do anything else
  event.respondWith(request);
});
Check Edge Workers page for configuration options.
Fastly Compute
Prerequisites
- Ensure your development environment meets the following requirements:
- Node.js installed.
- Node Package Manager (NPM) or yarn.
- An existing Fastly account is configured to handle your application’s traffic.
- Fastly Compute CLI installed locally.
- The Spec Worker Library.
- If this is your first Worker, then please use the example code.
- If your workers already have functionality, Spec's Product Success will help merge the Spec components into your Worker.
- Check out the configuration options for the Realtime Engine worker in #configuration.
Instructions
Configure the Worker
- Create a new Fastly Compute project, or open an existing project.
- Install the Spec Proxy Fastly Worker Package
npm i –save @specprotected/spec-proxy-fastly-worker
- Open the
index.jsfile- If this is your first worker, Spec recommends using the example code for your Worker.
- If you have existing workers, Spec's Product Success will help merge the Spec components into your Worker.
- Run
fastly compute buildto compile the JavaScript to a WASM binary.
Configuring Fastly Compute
- Log in to Fastly:
After installing the Fastly CLI, log into your Fastly account. Navigate to the “Compute” section and select “Create Compute Service”. - Configure the Compute Service:
- Enter the domain for the traffic that Spec will be protecting.
- Set up two "Host origin" backends:
- Application Server Origin
- Spec Proxy URL (spec-internal): This URL will be provided by Spec. Its prefix will match the domain being protected.
- Set the "Override Host" value to the Host address (likely the same for both backends).
- Generate an API Token:
- Create an API token for the Fastly CLI authentication.
- Ensure the token has global scope access and set its expiration to conform to your compliance requirements.
- Authenticate the Fastly CLI:
- Run
fastly profile createin your terminal. - Enter your API key when prompted. This stores your Fastly API key in a configuration file for future commands, avoiding the need to provide the token with each command.
- Run
- Deploy the Project to Fastly Compute:
- After saving your configuration changes, publish the project to a Fastly Compute service by running
fastly compute deployin your terminal.
- After saving your configuration changes, publish the project to a Fastly Compute service by running
Once these steps are completed, the Spec Fastly Compute Service will be live!
Fastly Worker Code
Spec provides an integration library for Fastly Workers, which is hosted on NPM as a public TypeScript package. This library can be integrated into your current Fastly compute implementation, or can be added to a fresh configuration.
Example Fastly Worker Code
/// <reference types="@fastly/js-compute" />

// Import required Spec methods from NPM package
import {
  specProxyProcess,
  setFastlyBackends,
} from "@specprotected/spec-proxy-fastly-worker";

// Sets backends for the Fastly to route traffic
// map of URL hostnames to Fastly backends
setFastlyBackends({
  // This is your origin destination backend
  "www.example.com": "origin",
  // This is your Spec Proxy deployment backend. URL provided by Spec
  "www.example.com.spec-internal.com": "spec-proxy",
});

// Spec Worker configuration
const config = {
  inlineMode: true,
  // due to Fastly backend services, disableSpecProxy must be set to false.
  disableSpecProxy: false,
};

addEventListener("fetch", (event) => {
  event.respondWith(
    specProxyProcess(event, confi)
  );
});
Check Edge Workers page for config options
Cache Control
Fastly has a lot of available cache options, and possible configuration for serving content as close to the requester as possible. Spec by default does not do any caching of requests. In Mirror Mode, we set the following header so Fastly will not cache our response that is backgrounded from the worker:
"Cache-Control": "no-store, private, max-age=0, no-cache"
It may be necessary to also set the following cache control headers in the worker configuration to also to Fastly from the worker level to disable caching from Spec:
event.request.headers.set("Surrogate-Control", "max-age=0");
event.request.headers.set("Cache-Control", "no-store, private, max-age=0, no-cache");
DNS Integration
DNS integration is the simplest integration method that Spec offers. Customers will need to add or modify their DNS records for their protected domains to route user traffic to the Spec Platform. The Spec Platform then routes the user traffic to the customer's origin servers.
Prerequisites
- Ensure that Spec has a certificate for your domain.
- Your Product Success representative will provide a CNAME record name and value for you to publish with your DNS provider so the Spec Platform can receive and/or process traffic for your protected domain.
- Confirm that you have the Spec Platform endpoint to which you will be adding
or changing your DNS record value.
- Speak with your Product Success representative if you do not already have this.
Instructions
- Log into your DNS provider and locate the record that holds the name for your protected domain.
- Alter CNAME record
- If you will be creating a new record, create a new CNAME record.
- If the existing record is not a CNAME, convert it to a CNAME record.
- Add or replace the CNAME record's value with the Spec Platform endpoint you received from your Product Success representative and save the entry.
- Wait a few minutes for the DNS record to propagate.
- Verify the change using
dig- the command should return the Spec Realtime Engine endpoint as the new CNAME value.- Example:
dig example.com +short
- Example:
Example DNS Change
Before
| Record Name | Type | Record Value |
|---|---|---|
| example.com | A | 93.184.215.14 |
After
| Record Name | Type | Record Value |
|---|---|---|
| example.com | CNAME | example.specprotected.com |
Testing
Testing modes differ based on the processing mode being utilized.
Testing for Pass-through and Active Processing
Testing Pass-through and Active modes can be performed locally by updating your local hosts file to point to a Spec staging IP. The process for this is as follows:
- If you don't have it already get your Spec staging hostname from the Spec platform team.
- Open your local hosts file in a text editor and add an entry that includes
IP addressof the staging version of the Spec staging hostname and your property'sdomain. For example:1.2.3.4 www.mysite.com - Open a browser and request that domain.
- Check that your site is functioning as expected, then remove the hosts file entry and save the file.
- Once you're happy with the functionality of your Spec configuration, you can go live.
Testing for CDN Mirror
Testing for CDN Mirror is dependent on the external service being used to send mirrored HTTPS requests to Spec, but the approach is to use debug headers to dynamically enable invoking the CDN configuration or edge worker that mirrors traffic to your Spec region.
Client Traffic Mirror
Spec may be configured to accept mirrored traffic from a wide variety of sources, including proxies, service meshes, and cloud load balancer. Traffic mirroring allows a copy of live production requests to be forwarded to Spec without impacting the behavior, latency, or reliability of the primary request path.
Mirrored traffic is typically used for:
- Passive analysis and observability
- Integration testing and contract validation
- Security and compliance review
- Testing configurations against real traffic
Below are several common examples of mirroring traffic from existing infrastructure.
Istio.io Mirror Example
Istio supports request mirroring (also referred to as traffic shadowing)
using VirtualService configuration. Mirrored traffic is routed to a service,
which may represent an external hostname.
Example VirtualService snippet:
apiVersion: networking.istio.io/v1beta1
kind: VirtualService
metadata:
  name: example-service
spec:
  hosts:
    - example-service
  http:
    - route:
        - destination:
            host: example-service
      mirror:
        host: www.client.com.specprotected.com
      mirrorPercentage:
        value: 100.0
Notes:
- Mirrored traffic is best-effort and may be dropped under load (istio configuration)
- Request headers and bodies are preserved
- Response data is not mirrored
- Mirroring can be enabled for a subset of traffic if desired
Envoy Mirror Example
Envoy supports request mirroring via request_mirror_policies on HTTP routes. Mirrored requests are sent to a configured cluster, which can represent an external URL.
In this example, the cluster resolves to www.client.com.specprotected.com.
static_resources:
  clusters:
    - name: spec_mirror
      connect_timeout: 5s
      type: logical_dns
      lb_policy: round_robin
      load_assignment:
        cluster_name: spec_mirror
        endpoints:
          - lb_endpoints:
              - endpoint:
                  address:
                    socket_address:
                      address: www.client.com.specprotected.com
                      port_value: 443
route_config:
  virtual_hosts:
    - name: backend
      domains: ["*"]
      routes:
        - match:
            prefix: "/"
          route:
            cluster: primary_service
            request_mirror_policies:
              - cluster: spec_mirror
                runtime_fraction:
                  default_value:
                    numerator: 100
                    denominator: HUNDRED
Key characteristics:
- Mirrored requests are sent asynchronously
- Failures or latency from the mirror destination do not affect the primary request
- Headers and request bodies are preserved
- Mirroring percentage can be dynamically adjusted
Google Cloud Load Balancer Example
Spec would be hosted outside any GCP project, so direct load balancer mirroring isn't possible. In this case, traffic can be mirrored using a load balancer extension, which behaves similarly to a service worker.
In this model:
- The GCP Application Load Balancer is configured with a traffic extension
- The extension receives a copy of each incoming request
- The extension forwards the request to Spec at:
- https://www.client.com.specprotected.com
- The original request continues to the primary backend unchanged
- Responses from Spec are ignored
How it works
- A client sends a request to your application.
- The load balancer invokes the configured extension during request processing.
- The extension asynchronously sends a copy of the request to Spec.
- The load balancer forwards the original request to the primary backend.
The extension acts as an isolation layer, allowing mirrored traffic to be sent outside the GCP project without adding Spec as a backend service.
Important notes
- Mirroring is best-effort and should not block request handling.
- Failures sending mirrored traffic must not affect the primary request path.
- Request headers and bodies may be forwarded, subject to extension limits.
- Spec does not participate in the response flow.
For other proxies, service meshes, or load balancer, consult the relevant documentation for request mirroring, traffic shadowing, or tap functionality. For Mirror traffic, Spec only requires an HTTP-compatible copy of the incoming request and does not participate in the response path.
Hub
This section covers how to accomplish common tasks within the Spec Hub.
How to Save a Search
Easily return to the views that matter most — no need to start from scratch every time.
When you’ve filtered down to just the sessions you care about — a specific event pattern, device type, or time window — saving that search lets you revisit it instantly in the future, without reapplying filters manually.
This guide walks you through how to save a search step-by-step.
Goal
Save a filtered session view for fast, repeated access — ideal for tracking a live investigation, reviewing high-risk behavior patterns, or monitoring ongoing fraud activity.
Steps to Save a Search
1. Navigate to the Sessions Search Page
From Spec Hub interface, click the Search menu item. This is where you can explore individual customer sessions and apply a wide range of filters to focus on the behavior that matters to you.
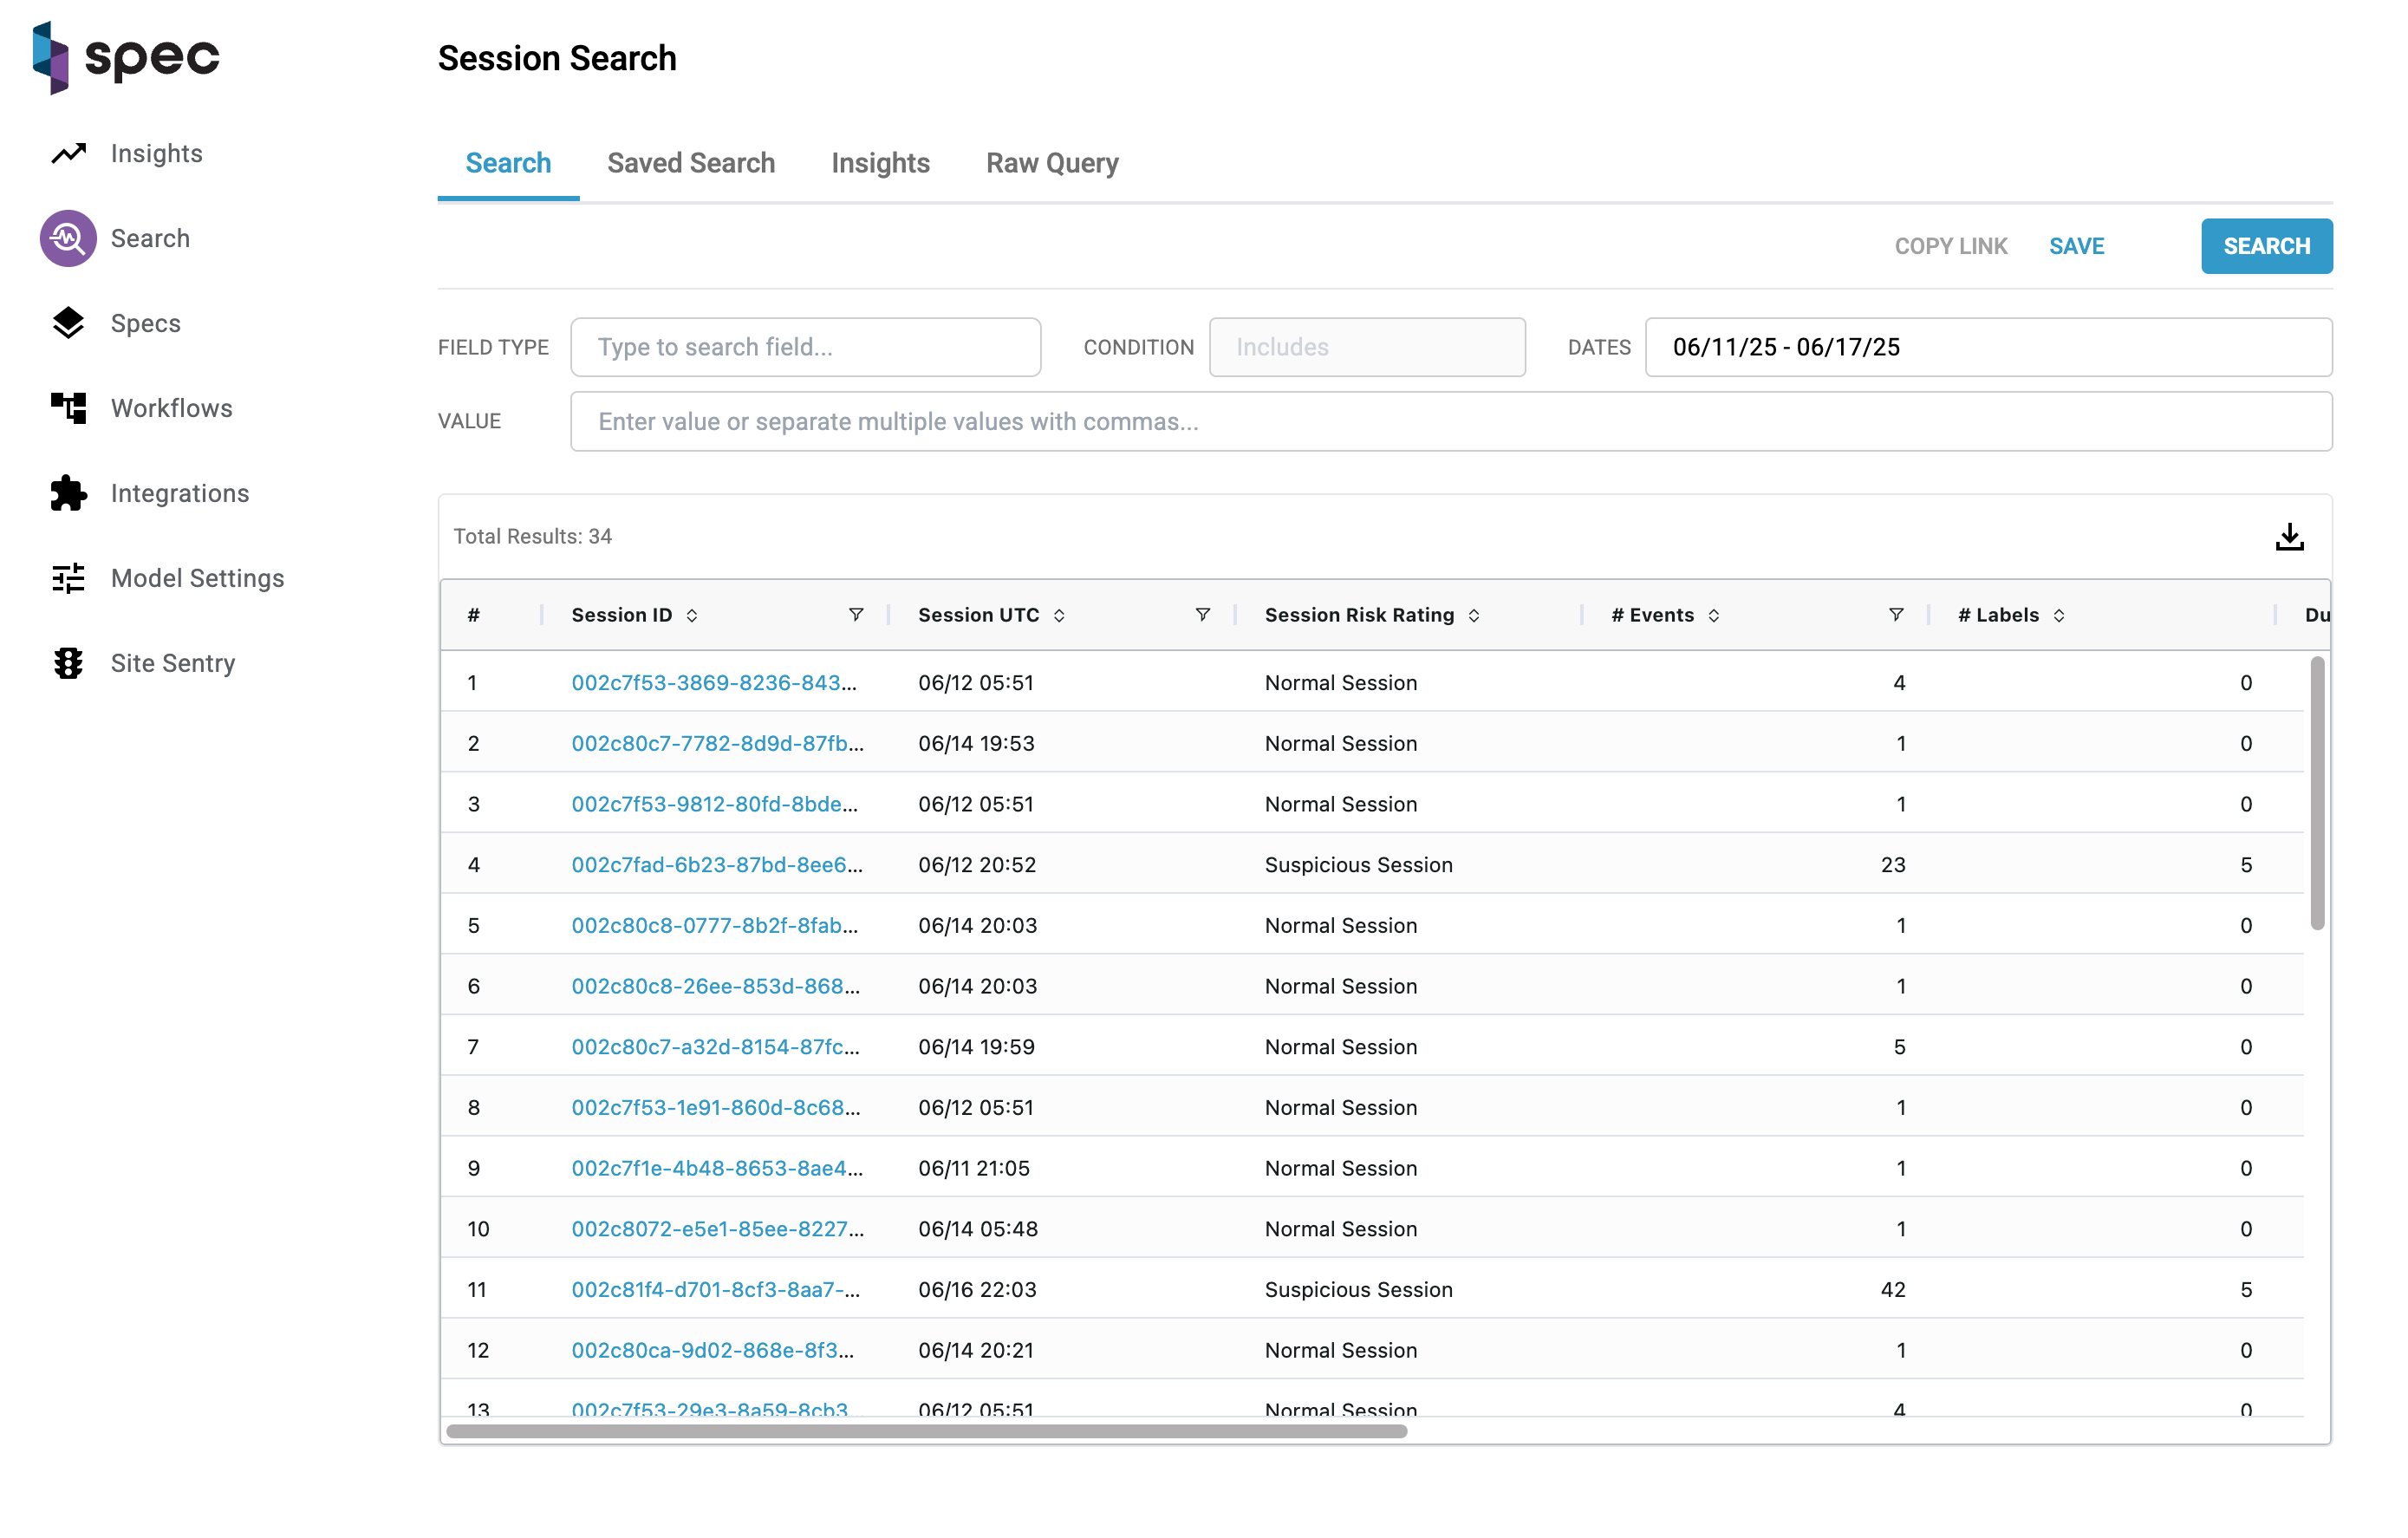
2. Apply Filters
Use the search filters to narrow down the data to your area of interest. This can include:
- Field-based filters: for example, sessions with a specific value in a field like
event_typeordevice_id. - Time range filters: such as the last 24 hours or a custom date window.
Learn more about filters and search syntax here.
3. Click “Save”
Once your search is configured the way you want it, click the Save button at the top of the search results panel.
4. Name Your Saved Search
After clicking Save, a modal window titled “Save new search” will appear.
- Enter a name that clearly describes your search in the input field.
- Click Save in the modal to confirm.
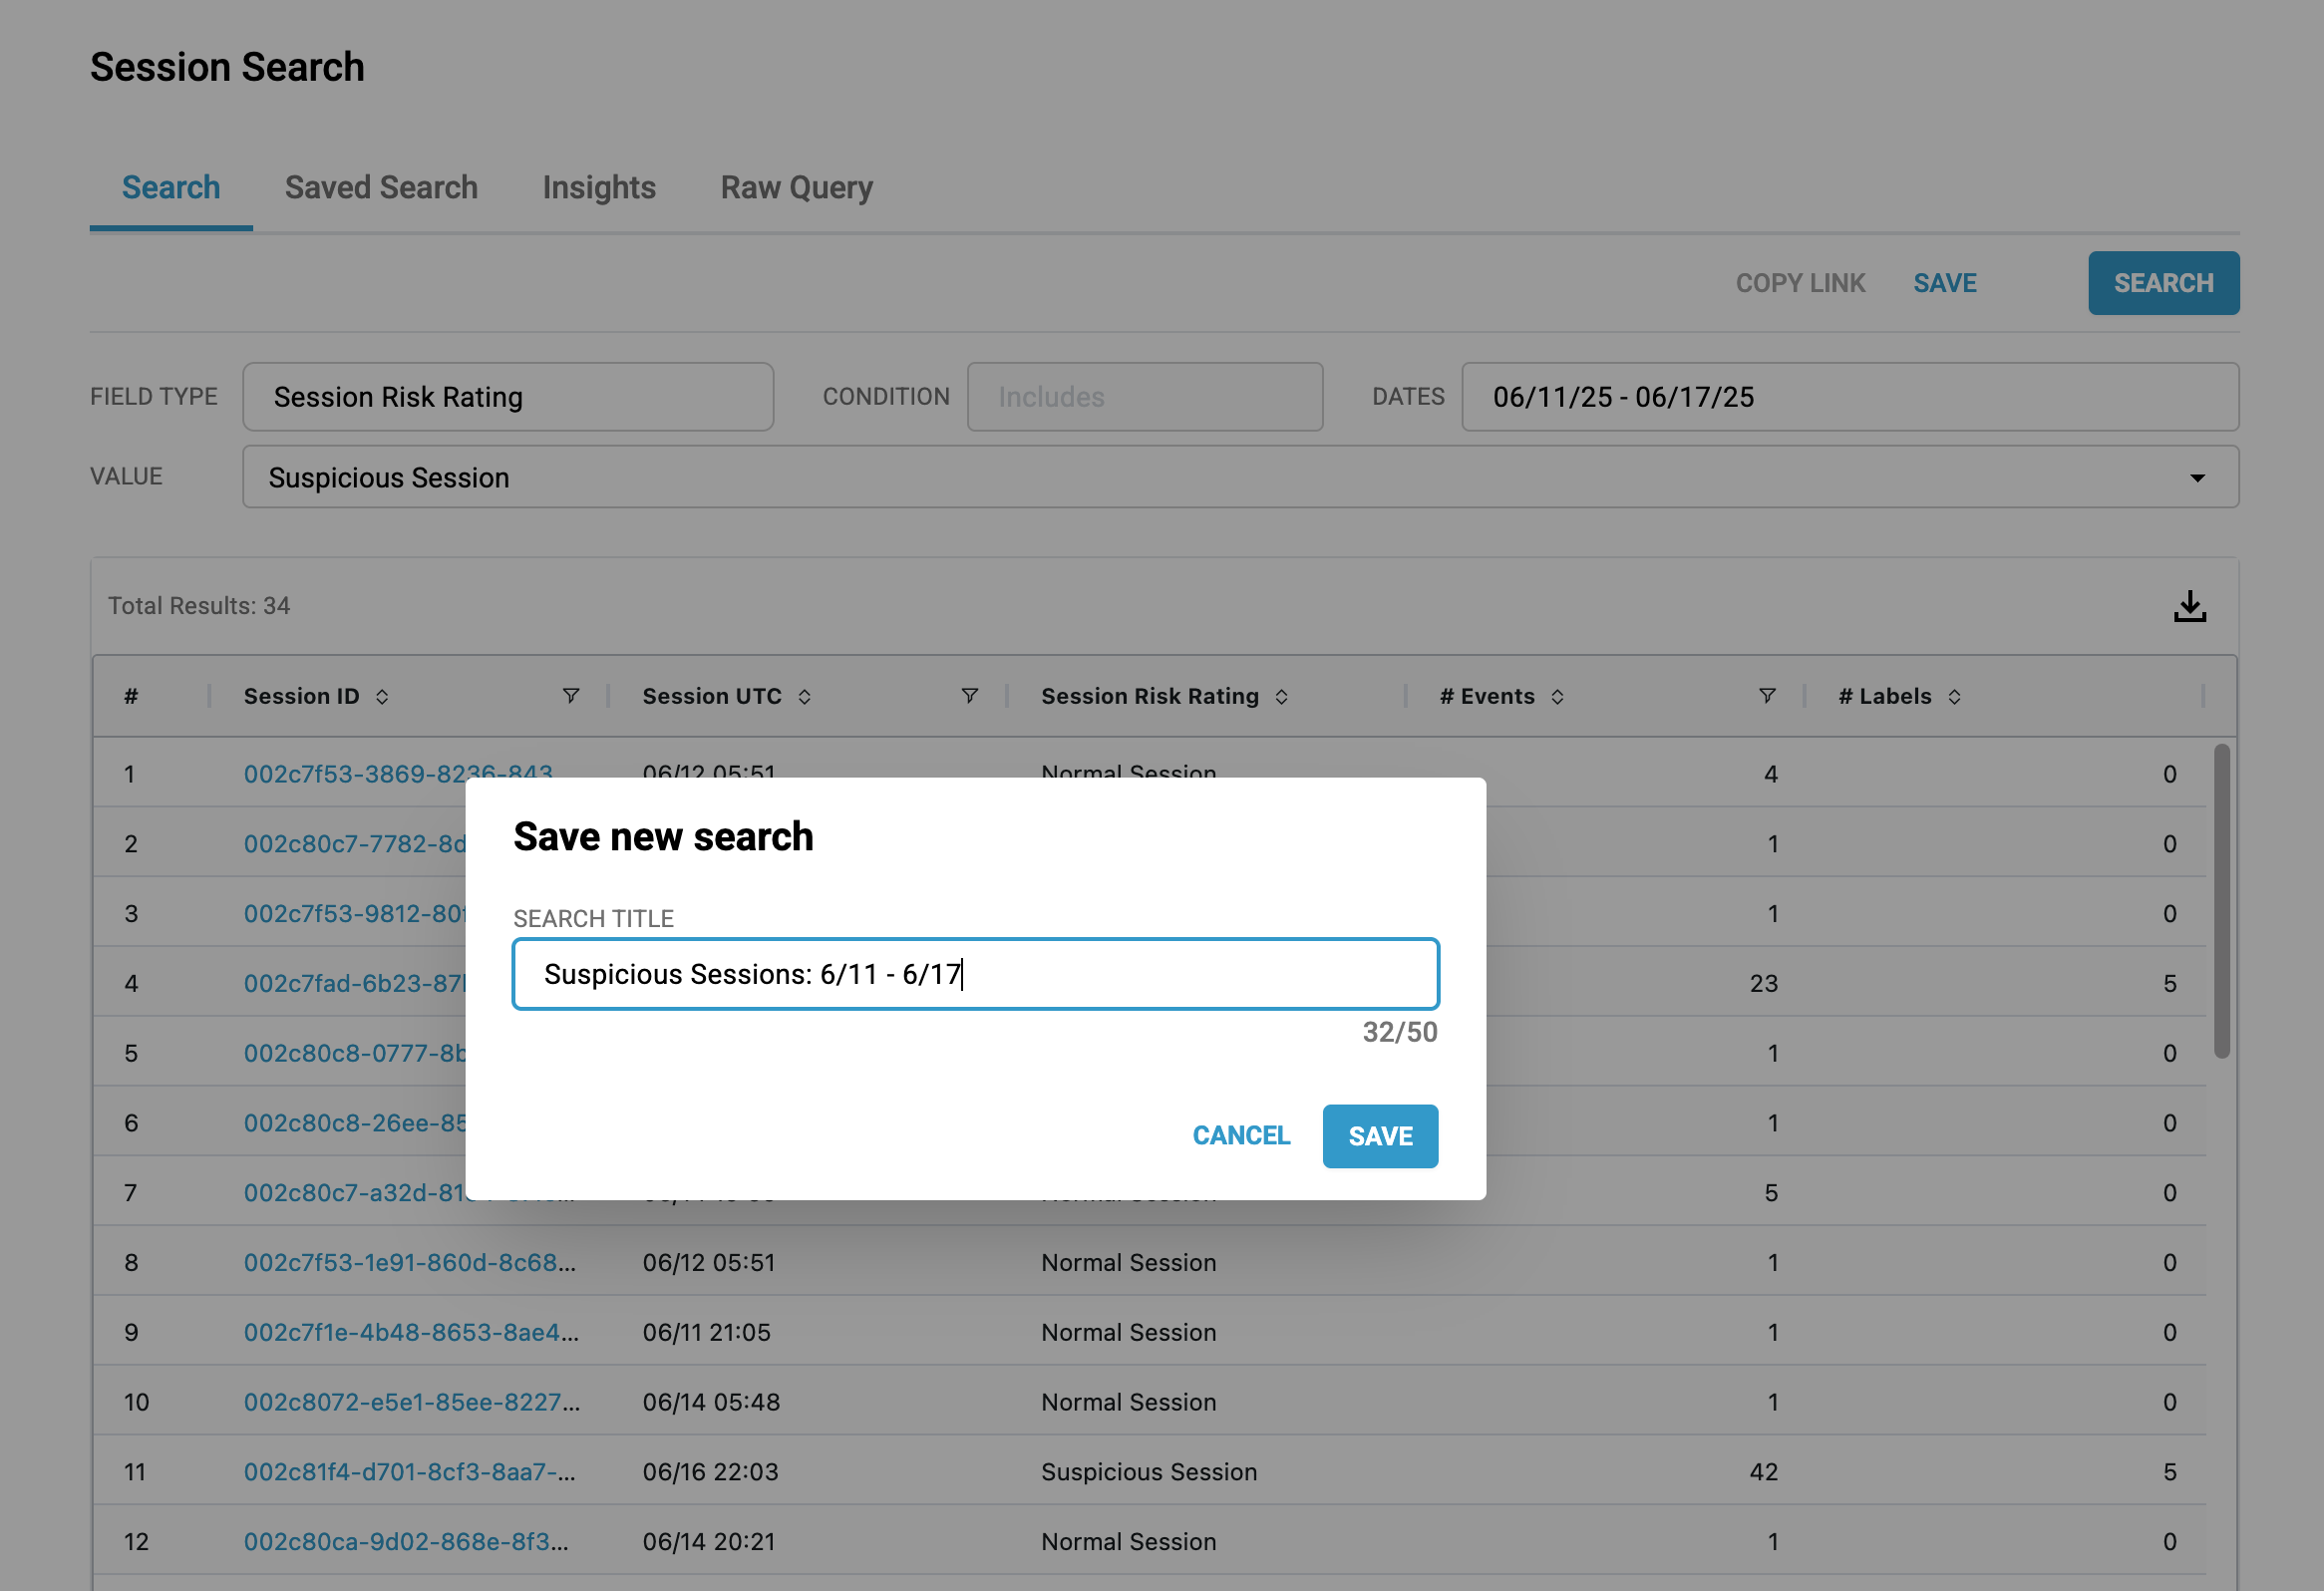
5. Confirmation and Redirect
Once saved:
- You’ll see a confirmation toast: “New search is saved.”
- A direct link to the saved search will be automatically copied to your clipboard — ready to paste and share.
- You will be redirected to the saved search page, where you can view the results immediately.
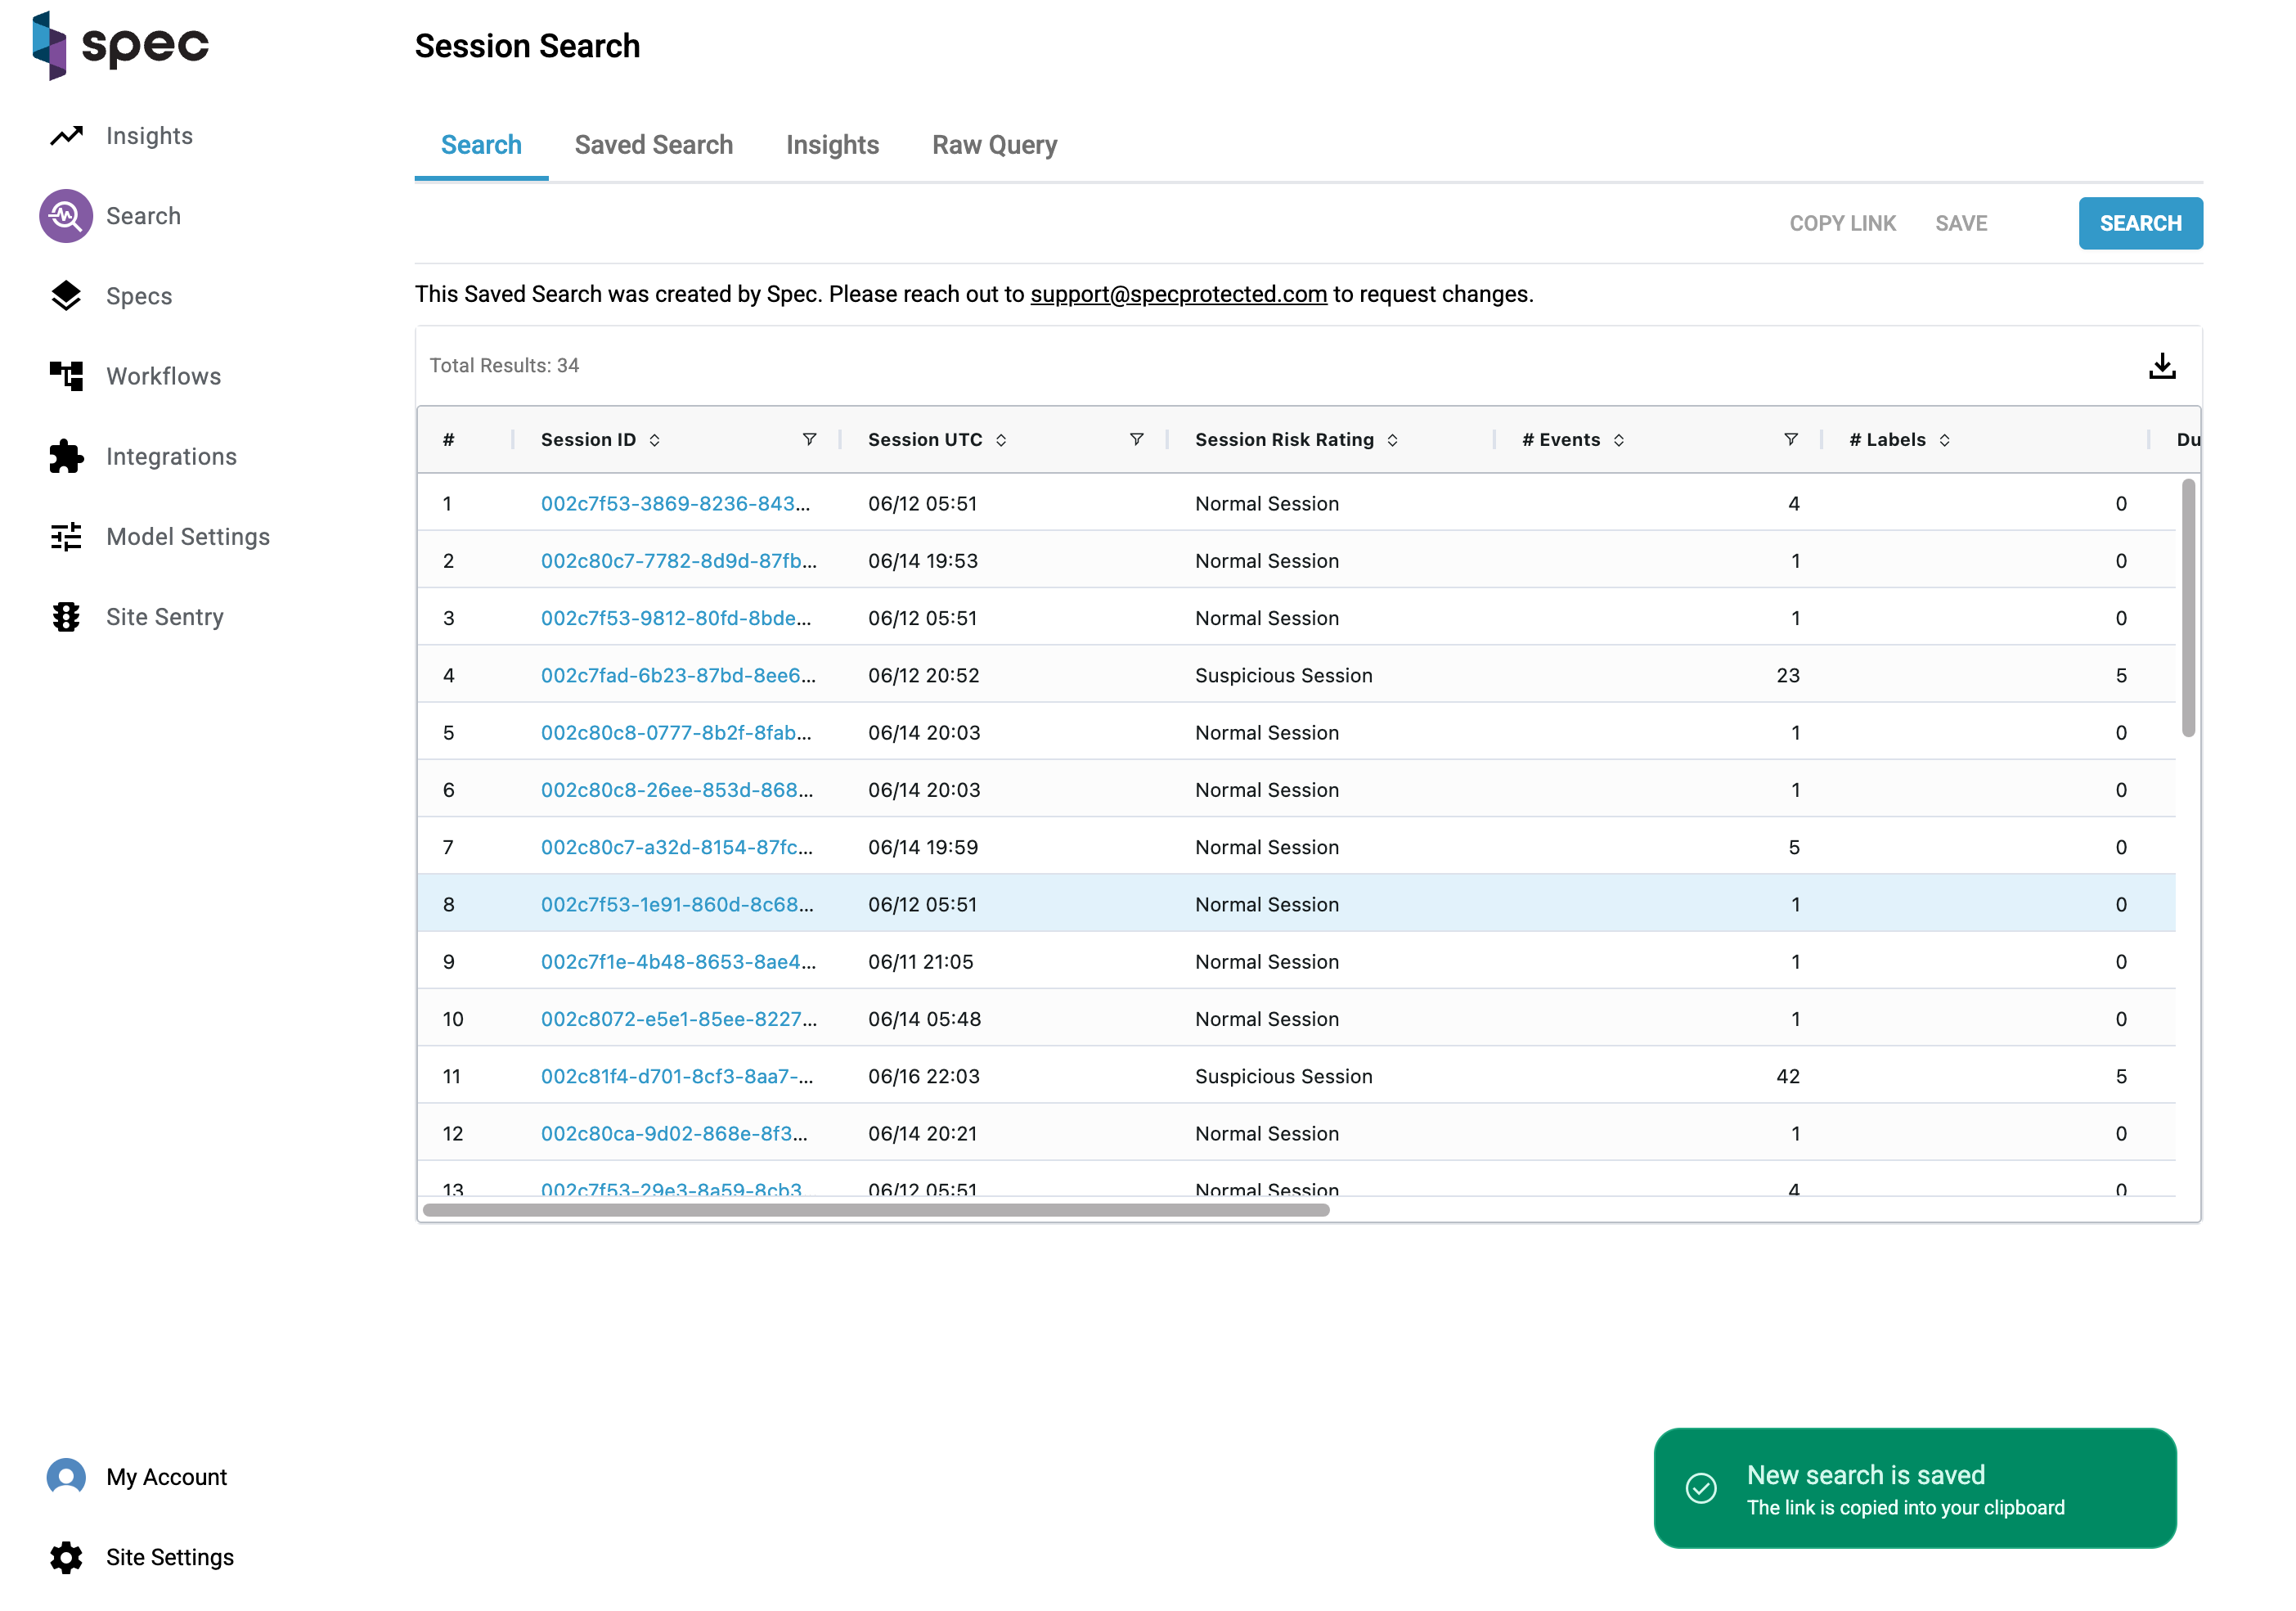
How to Access a Previously Saved Search
Saved searches are always accessible from the Session Search page.
- At the top of the page, locate the tabs near the filter area.
- Click the “Saved Search” tab.
- You’ll see a table of all saved searches associated with your environment.
- Click on the row of the search you want to revisit — you’ll be taken directly to the filtered session results.
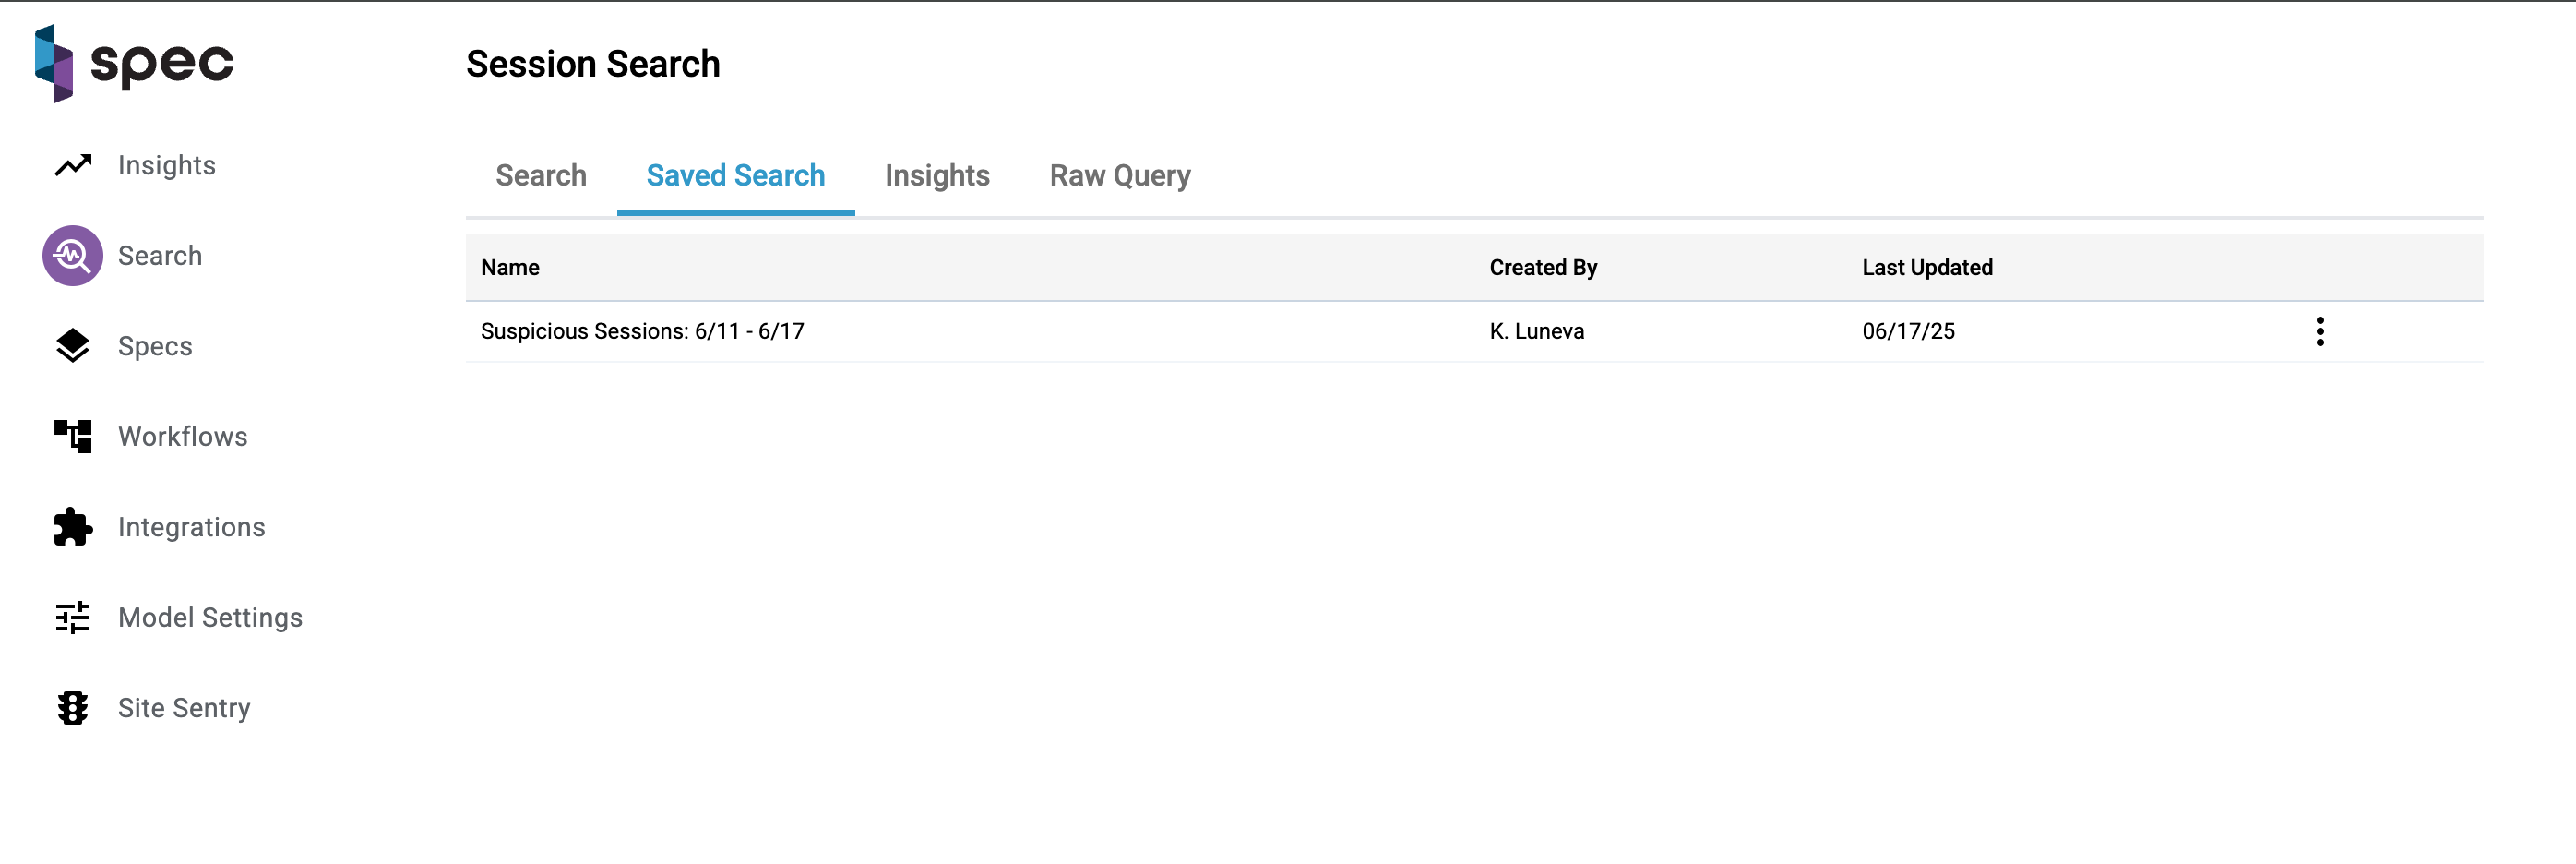
From this same table, you can also:
- Copy the link to any saved search to share it quickly with others.
- Delete a saved search if it’s no longer relevant to your workflow.
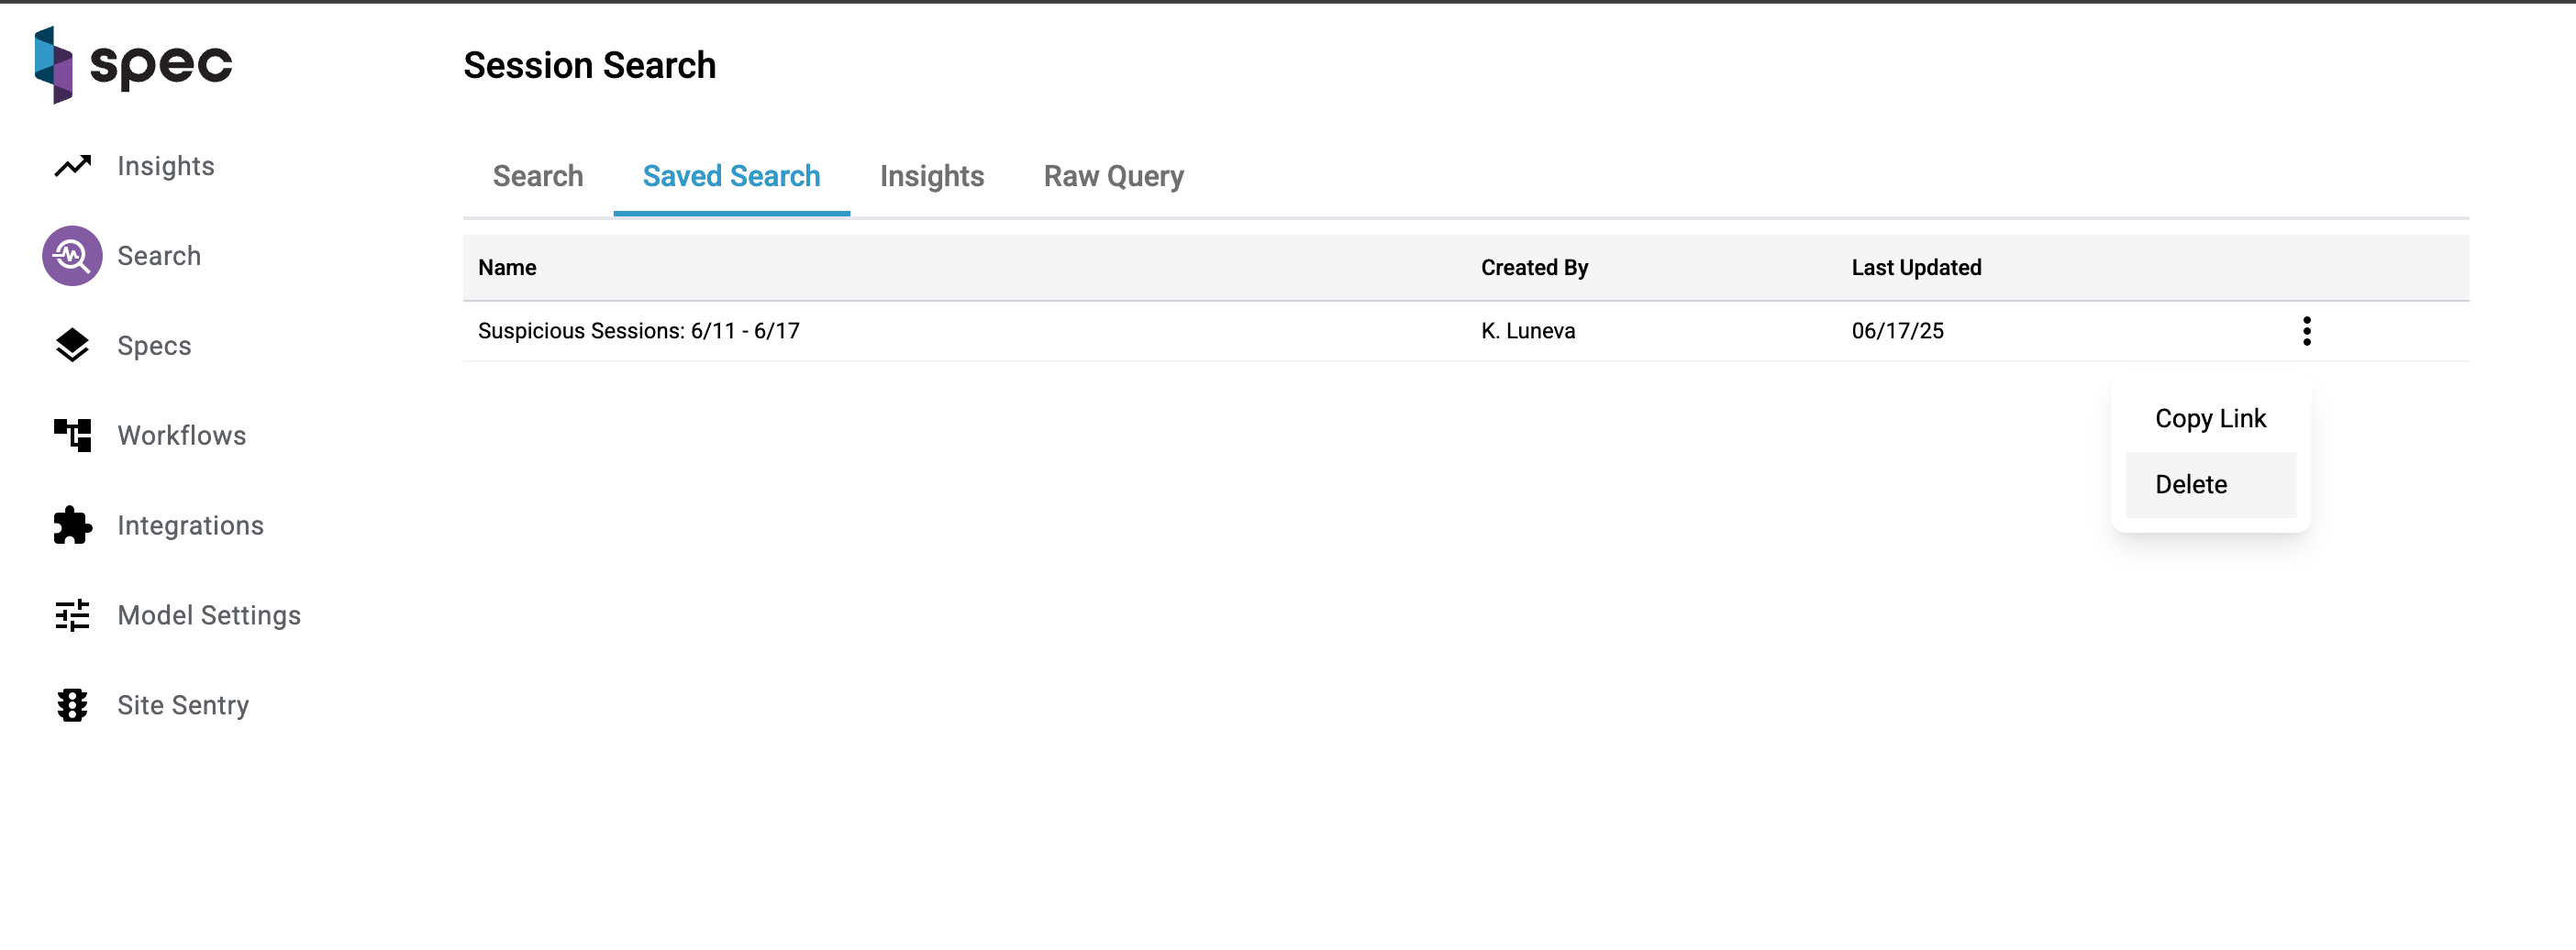
When to Use Saved Searches
-
Repeatable Investigations: Returning to the same filter set daily or weekly? Save it.
-
Team Collaboration: Share consistent filters with teammates to align reviews and workflows.
-
Ongoing Monitoring: Track behavior over time with saved searches you revisit and refine.
Keep It Organized
note
Over time, you may accumulate multiple saved searches. Consider using naming conventions that reflect the use case, audience, or time frame (e.g., High Risk Devices - Last 7 Days, Refund Spike Review, Policy Abuse Watchlist).
Spec Hub Authentication
The Spec Hub provides robust support for a wide range of Single Sign-On (SSO) solutions and SAML-compliant identity providers, ensuring full integration with most enterprise identity management systems. While a Spec administrator can manually provision individual users for Hub access on behalf of a client, leveraging supported SSO or SAML integrations enables centralized authentication and user management through the client’s existing identity infrastructure.
EASIE SSO
- Microsoft
SAML SSO
- Okta x
- Microsoft Entra ID (Formerly AD)
- Google Workspace
note
Spec also supports integration with custom SAML or OpenID Connect (OIDC) identity providers for authentication using most user management systems, provided they adhere to standard protocol specifications.
Okta Workforce
Overview
Spec supports a broad range of SAML and authentication providers, allowing easy integration with existing identity systems. This flexibility enables organizations to maintain centralized access control and streamline user management without compromising security or compatibility.
Okta Workforce requires a bit of additional configuration from an administrator. After receiving a Single sign-on URL and Audience URI (SP Entity ID) from a Spec representative, you can proceed with the steps outlined below.
Configuration
- Create a new enterprise application in Okta
- Navigate to Okta and sign in.
- In the Okta dashboard, select Admin in the top right corner.
- In the side navigation bar, select the Applications drop down and select Applications.
- Select Create App Integration.
- In the "Create a new app" integration modal, select the SAML 2.0 option and select the "Next" button.
- Once redirected to the Create SAML Integration page, complete the General Settings fields. An App name is required.
- Select Next. You'll be redirected to the Configure SAML page.
- Paste the "Single Sign-on URL" and the "Audience URI (SP Entity ID)" values that you received from Spec into their respective fields.
Map Okta claims to Spec attributes
Mapping the claims in your IdP to the attributes Spec uses ensures that the data from your IdP is correctly mapped.
- In the Okta dashboard, find the Attribute Statements (optional) section.
- For the Name field, enter mail.
- For the Value field, choose user.email from the drop down.
- Select the Add Another button to add another attribute.
- For the Name field, enter first Name.
- For the Value field, choose user.firstName from the drop down.
- Select the Add Another button to add another attribute.
- For the Name field, enter lastName.
- For the Value field, choose user.lastName from the drop down.
- Scroll to the bottom of the page and select the Next button to continue.
- You will be redirected to the Feedback page.
Assign selected user or group in Okta
You need to assign your users/user groups to your newly created Okta application in order to grant access to the Spec Hub. In the Okta dashboard, select the Assignments tab.
- Select the Assign drop down. You can either select Assign to people or Assign to groups.
- In the search field, enter the user or group of users that you want to assign to the enterprise application.
- Select the Assign button next to the user or group that you want to assign.
- Select the Done button to complete the assignment.
- Provide Spec with Okta application Metadata URL
Once you have completed the setup in Okta, you will be redirected to the application instances page with the Sign On tab selected.
Under Sign on methods, copy the Metadata URL. Provide this Metadata URL to your Spec representative for the final configuration.
Data Import & Export
Spec supports both exporting and importing captured traffic data to enable flexible integration with existing client workflows and data pipelines. Data can be transferred using multiple mechanisms depending on client requirements, including cloud object storage (such as Amazon S3 or equivalent services) and managed file transfer endpoints. In practice, Spec primarily exchanges data with clients using SFTP servers, providing a simple, secure, and widely supported interface for moving structured data between environments. For example, Spec may export processed results to a client-managed SFTP server for downstream consumption, or import captured traffic and metadata from an SFTP drop location maintained by the client. Cloud storage buckets can also be used for batch exports or archival use cases when direct file transfer is preferred.
Data Export
Spec supports exporting data using multiple delivery mechanisms to integrate cleanly with client-managed systems. The two most common export methods are:
- SFTP — the primary and most widely used mechanism
- Cloud object storage (Amazon S3 or equivalent)
The specific method used depends on client requirements, security posture, and operational preferences.
SFTP Configuration
In an SFTP-based export setup:
- The client provides an SFTP server endpoint
- Spec authenticates using an SSH public key
- Exported files are written to a designated directory on the server
- Typical configuration details include:
| Field | Value |
|---|---|
| Hostname | Client-provided |
| Port | 22 (or client-specified) |
| Username | Client-provided |
| SSH Public Key | Provided by Spec |
Clients must configure the SFTP server to allow authentication using the Spec public SSH key. This is typically done by:
- Associating the public key with a dedicated user or role
- Restricting that user’s access to a specific directory or chroot
- Granting write, read, and delete permissions only where exports are placed
- Password-based authentication is not required.
Network Requirements
Clients must allow inbound traffic from Spec to the SFTP server on the configured port (typically TCP 22). If IP allow-listing is required, Spec will provide the necessary source address information.
S3 Configuration
Spec can also export data directly to a client-managed Amazon S3 bucket. This model is commonly used for high-volume exports or when integrating with downstream analytics and storage pipelines.
Access Model
Spec accesses the S3 bucket by assuming a client-managed IAM role using AWS Security Token Service (STS). This role must:
- Trust the Spec provided AWS role
- Require an External ID for role assumption
- Grant permissions to list, read, and write objects in the target bucket
The External ID helps prevent the confused-deputy problem and must be shared out-of-band during setup.
Required Permissions
The IAM role must allow the following actions on the export bucket:
s3:ListBuckets3:GetObjects3:PutObject
Below is an example IAM role policy granting a client managed Spec role access to a single bucket:
{
  "Version": "2012-10-17",
  "Statement": [
    {
      "Sid": "AllowListBucket",
      "Effect": "Allow",
      "Action": "s3:ListBucket",
      "Resource": "arn:aws:s3:::example-client-export-bucket"
    },
    {
      "Sid": "AllowReadWriteObjects",
      "Effect": "Allow",
      "Action": [
        "s3:ListBucket",
        "s3:GetObject",
        "s3:PutObject"
      ],
      "Resource": "arn:aws:s3:::example-client-export-bucket/*"
    }
  ]
}
This is an example trust policy that allows a Spec managed AWS role to assume the client managed role:
{
  "Version": "2012-10-17",
  "Statement": [
    {
      "Sid": "AllowSpecAssumeRole",
      "Effect": "Allow",
      "Principal": {
        "AWS": "arn:aws:iam::<SPEC_AWS_ACCOUNT_ID>:root"
      },
      "Action": "sts:AssumeRole",
      "Condition": {
        "StringEquals": {
          "sts:ExternalId": "<SPEC_EXTERNAL_ID>"
        }
      }
    }
  ]
}
The associated trust policy must require an External ID and allow Spec to assume the role. Spec will provide the AWS account ID and External ID during configuration.
important
Why the External ID is required?
The External ID protects against the confused deputy problem and ensures that only Spec can assume the role, even if the role ARN is disclosed.
SFTP Import
Spec data may be enriched by supplemental data derived from customer systems. For example, an event may be augmented with internal identifiers, environment metadata, or other ownership information supplied by the customer.
Security is a top priority at Spec, especially when exchanging sensitive files with our clients and partners. For this reason, we use SFTP (Secure File Transfer Protocol) for all file transfers. SFTP provides several key security benefits:
- Encrypted data in transit; files and credentials are protected from interception SSH key–based authentication
- avoids passwords and reduces attack surface Access control
- Each client is provisioned with a dedicated user and scoped permissions Reliability and auditability
- Suitable for automated and recurring file transfers
Connection Details: The table below lists the required connection details:
| Field | Value |
|---|---|
| Hostname | Provided by Spec |
| Port | Provided by Spec |
| Username | Provided by Spec |
| Public SSH Key | Provided by Client |
Step 1: Generate an SSH Key Pair (Client Action)
Before we can provision access, you must generate an SSH key pair. This consists of:
- A private key (kept securely by you)
- A public key (shared with Spec)
Run the following command on your local machine or server:
ssh-keygen -t rsa -b 4096 -C "your_company_name"
Prompts you will see
- File location: You can accept the default, or give your key a name (default is id_rsa).
- Passphrase: Optional but recommended for added security.
This command will generate two files:
- id_rsa → Private key (do not share)
- id_rsa.pub → Public key (share with Spec)
important
Send us the contents of the public key file (.pub) only. Never share your private key.
Step 2: Spec Provisions an SFTP User
Once we receive your public SSH key:
- We provision a dedicated SFTP user for your organization
- We associate your public key with that user
We will provide you with:
- SFTP hostname
- Username
- Port
At this point, your account will be ready to connect.
Step 3: Connect to the SFTP Server
Below are common ways to connect, depending on your setup.
Option A: Command Line (macOS / Linux)
sftp your_username@sftp.partners.spec-internal.com
If your key is not in the default location:
sftp -i /path/to/id_rsa your_username@sftp.partners.spec-internal.com
Once connected, you can use standard SFTP commands:
ls        # list files
cd        # change directory
put file  # upload file
get file  # download file
exit      # disconnect
Option B: GUI Clients
If you prefer a graphical interface, most SFTP clients support SSH keys:
- FileZilla
- Cyberduck
- WinSCP
Configuration typically includes:
- Protocol: SFTP
- Hostname: provided by Spec
- Username: provided by Spec
- Authentication: SSH Private Key
- Port: default 22 (unless specified)
Usage
Upon connection, users are automatically placed in their designated root directory (/). Within this space, you have full permissions to create, remove, and manage folders, and the directory structure is entirely up to you.
Need Help? If you run into issues generating keys, connecting, or transferring files, our team can help troubleshoot and validate your setup. Once access is established, we’re happy to assist with testing and confirming successful file delivery.
Inline Networking
The Realtime Engine is highly adaptable, capable of operating seamlessly within a wide range of networking configurations. Depending on the specific network topology, multiple integration options are available to ensure optimal performance and compatibility between Spec and your protected origin.
important
These network configurations apply exclusively to Inline processing modes (refer to Processing Modes). In Mirror processing mode, Spec does not handle traffic forwarding to the origin, and these downstream routing configurations are not utilized.
Default Inline Integration
The default inline integration with Spec is where DNS resolves to a CDN. The request then is sent through a worker code bundle, which forwards Spec for realtime analysis before resolving to origin servers. Our realtime engine requires a downstream SSL certificate that is valid for the incoming hostname (unless Destination Routing is enabled) on the downstream origin. For more information on the service worker integration, check out Service Workers for more information on how to use this integration.

Advanced Routing
The following routing configurations extend the default inline integration behavior and are designed to offer greater flexibility in handling hostnames and SSL with the realtime engine.
Distributed Networking
Spec’s distributed networking capabilities allow traffic to be intelligently routed to multiple origin servers using one or more hostnames. This enables Spec to operate as a load balancer, efficiently managing traffic across various IP addresses or hostnames in both 1:1 and 1:N deployment models.
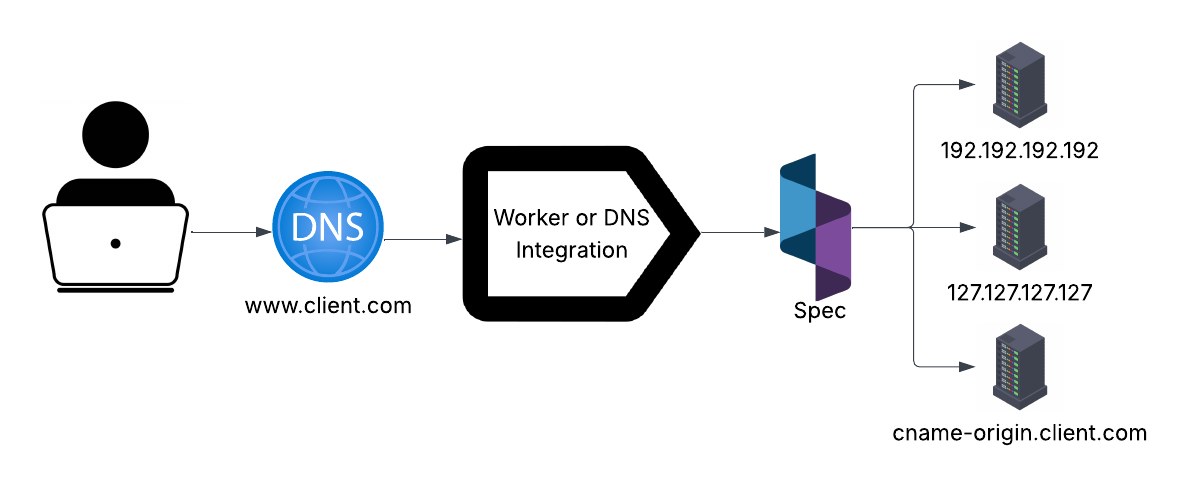
note
In this configuration, Spec distributes traffic evenly across all downstream hosts. Traffic allocation is randomized to ensure a balanced distribution under typical load conditions without affecting processing overhead. This feature is compatible with both Destination Routing and Worker Sidechain configurations.
Destination Routing
Our realtime engine requires a downstream SSL certificate that is valid for the incoming hostname, unless destination routing is configured. In this configuration, additional SSL certs and hostnames may exist upstream from Spec, and the realtime engine will use a defined hostname as the SSL hostname, while using the incoming host value for the HTTP Hostname.
This is useful to manage many hostnames and certificates at the CDN layer instead of the origin servers, which may not contain the same certificates. In order for destination routing to work, you must have at least one hostname certificate installed on your origin server.
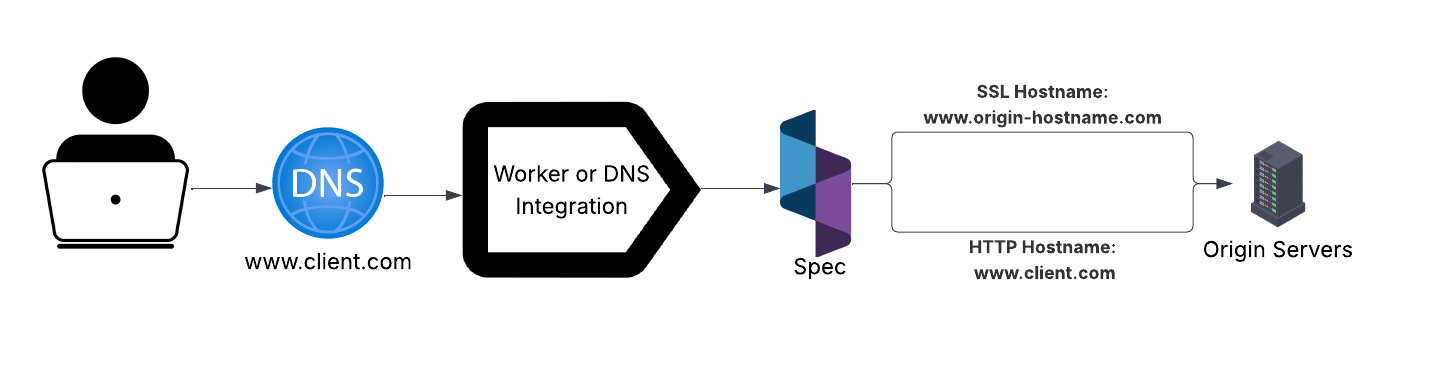
note
In this configuration, the existing HTTP hostname-based routing between the CDN and the origin is preserved. It also enables Spec to create secure encrypted connections between the Realtime Engine and protected origin servers, ensuring end-to-end security while maintaining compatibility with upstream TLS expectations.
Worker Sidechain
The worker sidechain configuration creates the lowest barrier integration, which also provides the most flexibility, at the expense of overall latency. The logic in the service worker must be updated to first check for the existence of a signed header from Spec servers, if a signed header is found the request bypasses Spec and heads directly to origin servers. Otherwise, the request is sent to Spec for signature using enterprise encryption protocols.
This allows Spec to exist outside of the direct network path, but it does introduce 1 additional network hop. Instead of going directly to an origin server, Spec must go through the CDN and worker layer a second time. This method can be implemented in staging environments where hostnames, SSL certificates, and other configurations are in constant subject to change.
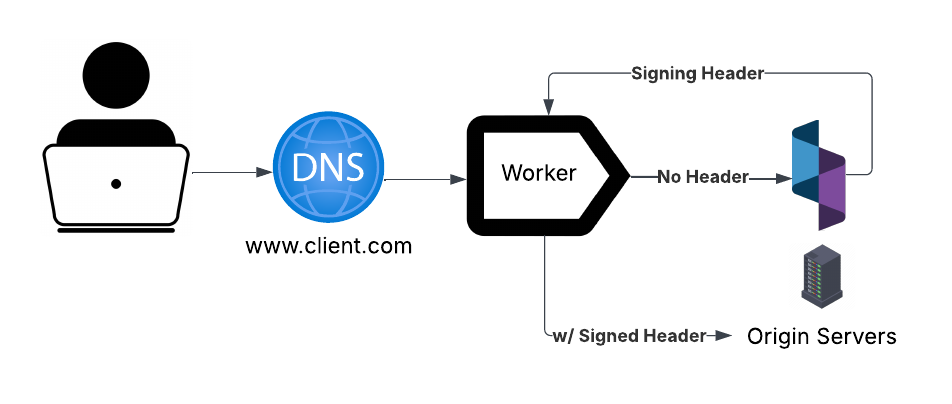
note
Due to the secondary invocation of the service worker, this network path introduces two additional hops compared to alternative implementations. As a result, traffic volume through both the CDN and Worker layers is effectively doubled. The primary advantage of this integration is that all downstream and upstream network modifications from the worker can be performed independently of Spec's configuration.
Glossary
Releases
Each release of the Spec platform includes the latest security patches and stable features that have successfully passed internal testing and quality assurance procedures. Releases are broken into two types of upgrades: minor and major.
Minor Upgrades
Any platform change that does not interrupt or inhibit the flow of traffic. Realtime Engine, Spec Hub, security patch, or other upgrade that does not require action.
Potential Impact
Negligible to none: Updates are generally no impact, but if a rare exception is detected, the update is immediately and automatically rolled back to the last stable version.
Examples
- Realtime Engine security patches are applied to address vulnerabilities and improve system stability.
- Stable release features are now available for general use.
- Resource limits have been increased to support higher workloads and improve performance.
Frequency
Often, 2-3 times per week.
Communication
These updates are available in our weekly release notes, updated documentation pages, or via preferred contact method.
Scheduling
These updates are vital to providing the best security posture and remain at the discretion of Spec.
Major Upgrades
A platform change that requires Spec to briefly pause processing data from the Realtime Engine, or requires an update from the client.
Potential Impact
Medium to none: May require client intervention to make configuration changes or require a maintenance window. Any potential impact will be communicated to the client prior to the update.
Examples
- A major database version update or other significant data migration will be performed to ensure system compatibility and performance.
- A service worker version update will be deployed to introduce improvements and maintain optimal functionality.
Frequency
- Rare, ~1 per year.
Communication
A Spec representative will proactively contact you ahead of any major upgrades to arrange an off peak hours time to perform the update.
Maintenance Windows
A major upgrade may require a brief window of-out-of-line maintenance. This window will be communicated with your team in advance, and in most cases the upgrades are a no-op.
Spec may remove the Realtime Engine from the network topology briefly to perform major upgrades. This is done via DNS and Spec managed service worker, but may vary depending on integration type.
tip
To disable the Realtime Engine from the worker, it is possible to set
disableSpecProxy = true in the service worker configuration.
During this time, active mitigations and data collection will be offline.
note
If operating without active mitigations is not an option, Spec can forward to any internal maintenance page to temporarily pause normal site activity during the duration of the major update.
Release FAQ
When does Spec conduct releases?
Stable release features are deployed into staging and non-production environments weekly on Tuesday mornings, allowing for pre-production validation.
Production stable release features are deployed between Wednesday and Thursday. Security patches may be deployed more frequently.
Where can I get release notes?
Release notes for each deployment are compiled and distributed by your Spec representative upon request.
How does Spec handle zero downtime?
The release process for the Realtime Engine maintains zero downtime and operates transparently to end users. Each deployment provisions a fresh set of instances to replace the previous version. Before accepting production traffic, the platform conducts a series of automated tests to confirm successful initialization and core functionality. Once all validations pass, the new instances are integrated into the request handling pool as the old ones are drained and phased out.
How are releases monitored?
Automated monitoring and alerting systems verify the health and readiness of individual use case configurations of the Realtime Engine prior to promotion into the production environment.